. 2009 Jun 26;137(7):1320-30.
doi: 10.1016/j.cell.2009.04.018. Epub 2009 Jun 11.

BASL controls asymmetric cell division in Arabidopsis

Affiliations

BASL controls asymmetric cell division in Arabidopsis

Juan Dong et al. Cell. .

Abstract

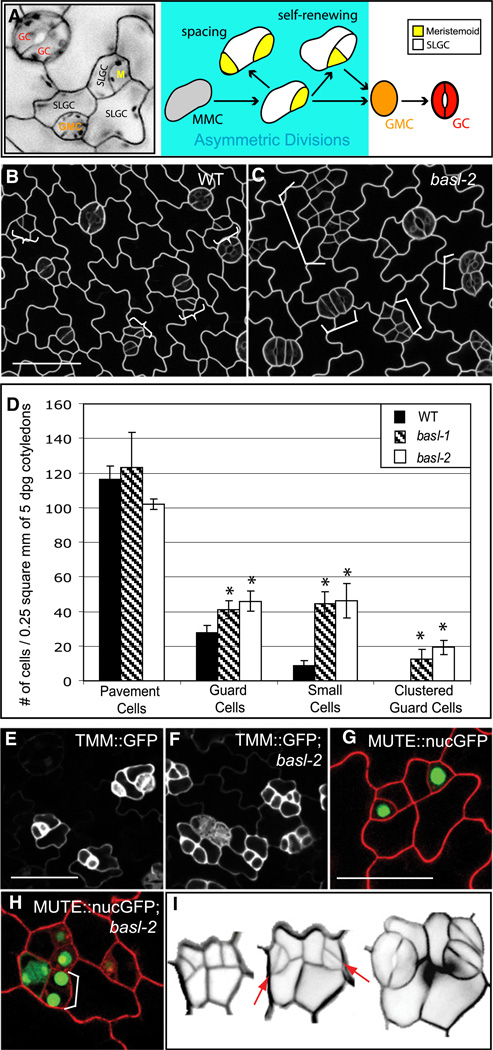
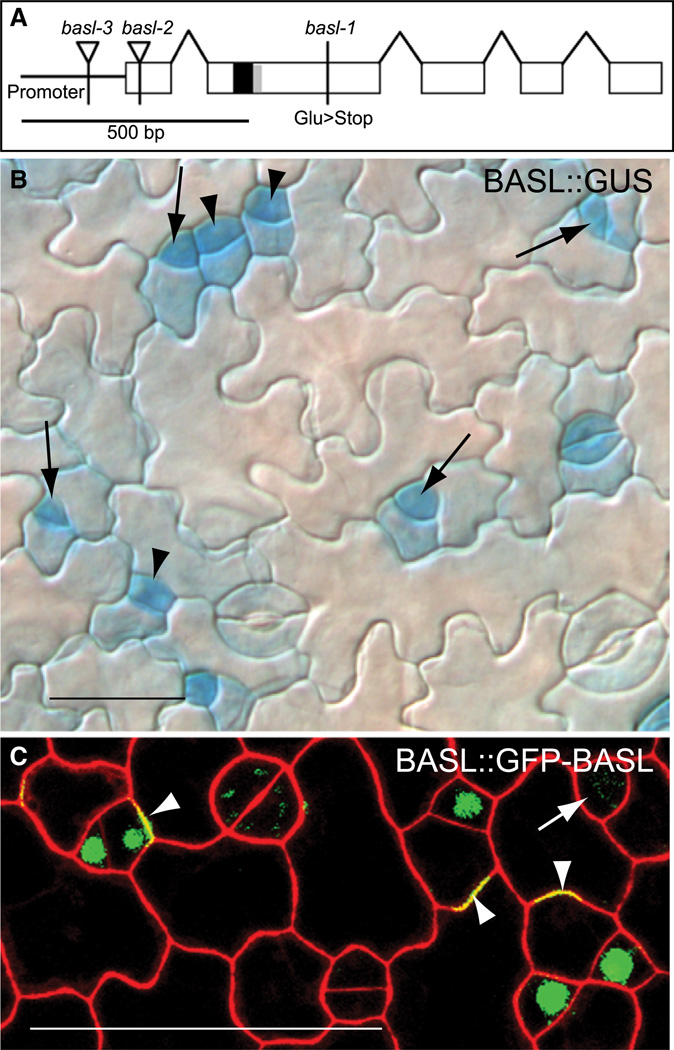
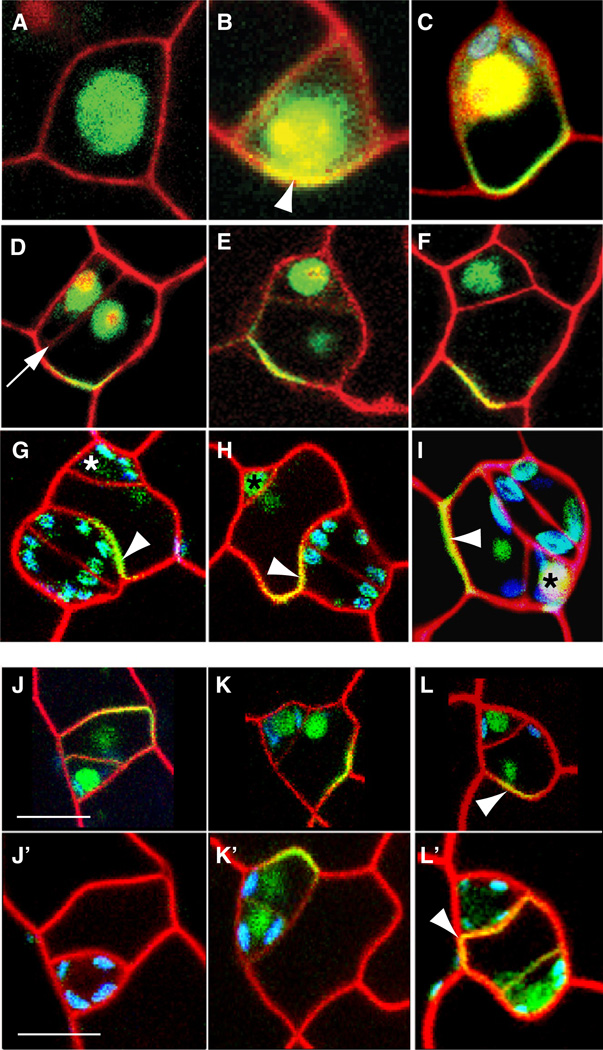
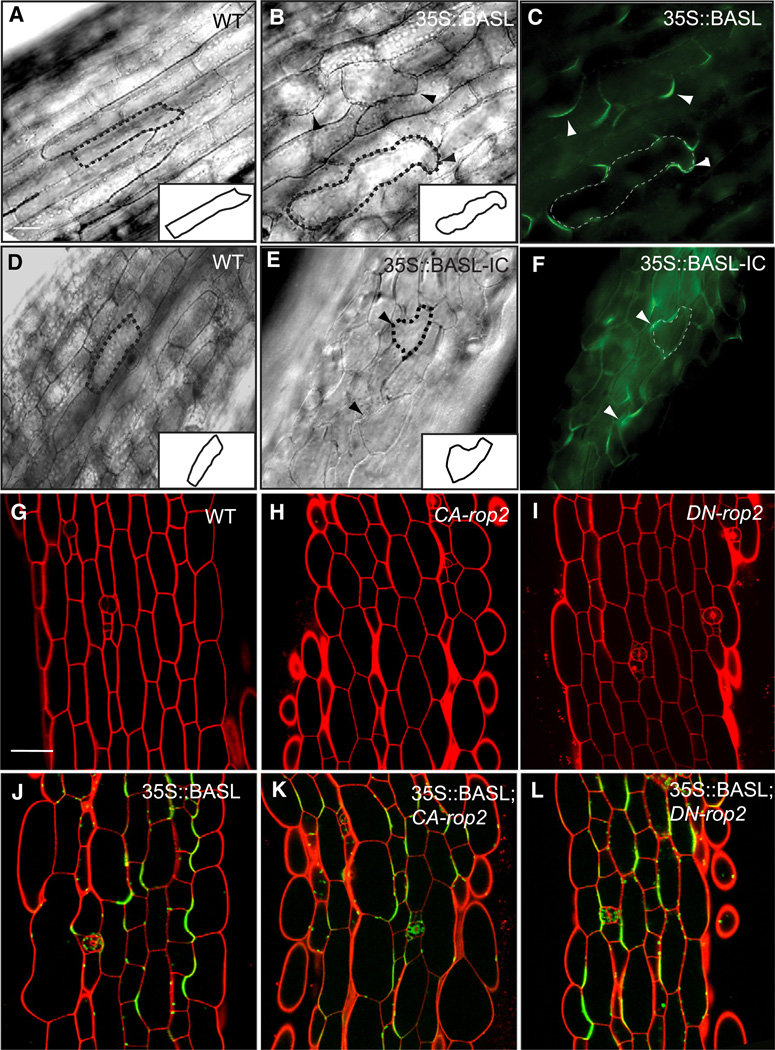
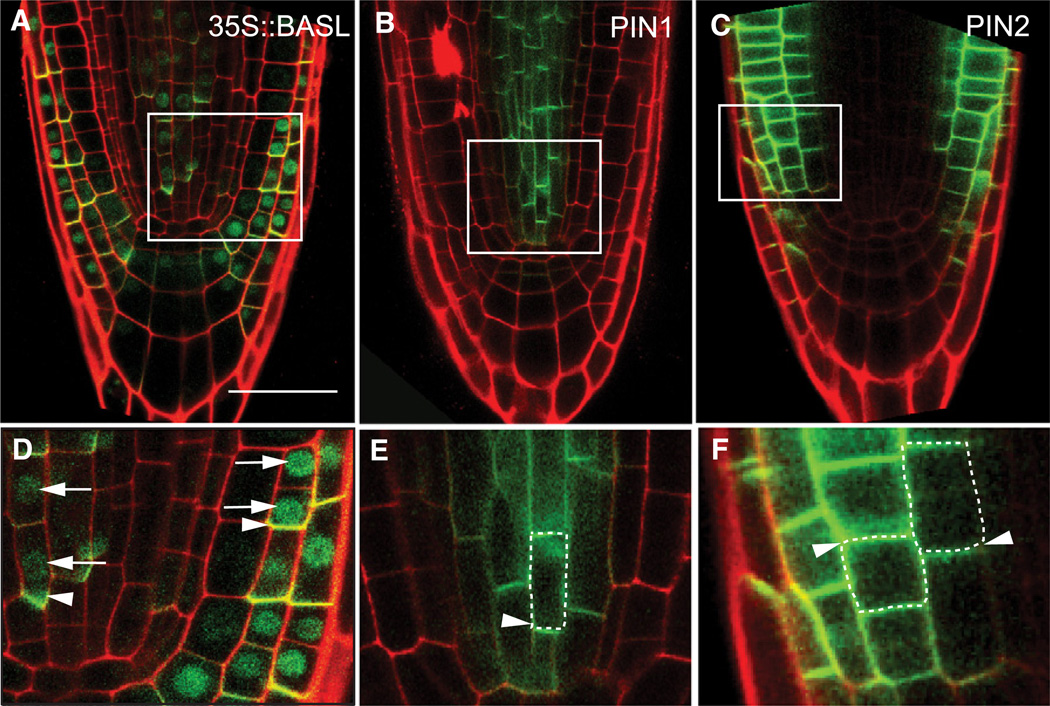
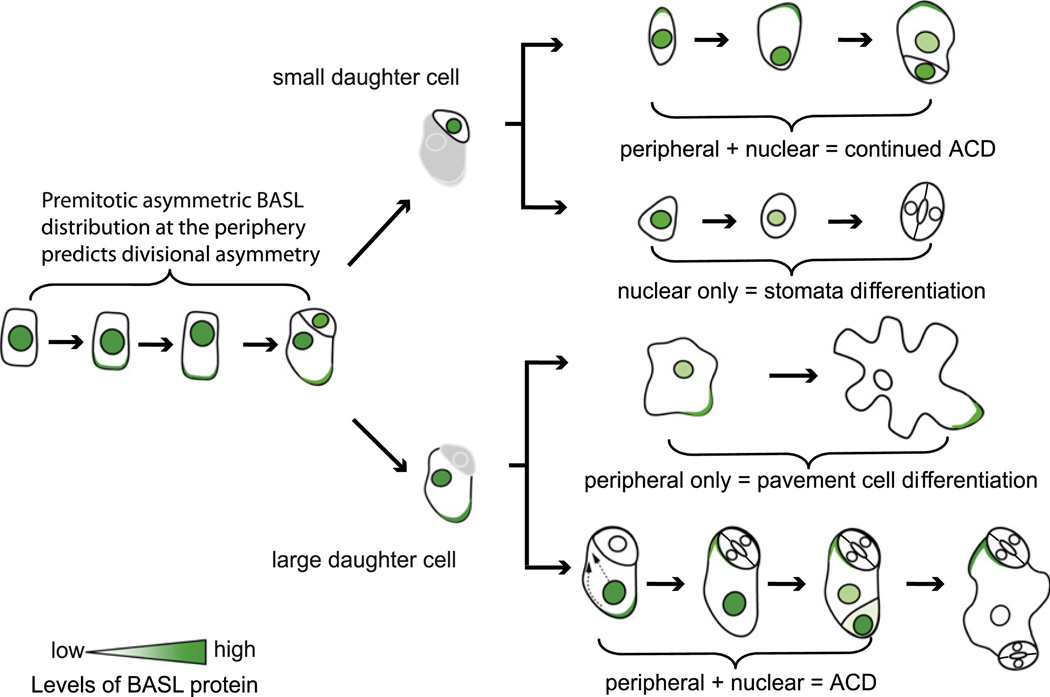
Development in multicellular organisms requires the organized generation of differences. A universal mechanism for creating such differences is asymmetric cell division. In plants, as in animals, asymmetric divisions are correlated with the production of cellular diversity and pattern; however, structural constraints imposed by plant cell walls and the absence of homologs of known animal or fungal cell polarity regulators necessitates that plants utilize new molecules and mechanisms to create asymmetries. Here, we identify BASL, a novel regulator of asymmetric divisions in Arabidopsis. In asymmetrically dividing stomatal-lineage cells, BASL accumulates in a polarized crescent at the cell periphery before division, and then localizes differentially to the nucleus and a peripheral crescent in self-renewing cells and their sisters after division. BASL presence at the cell periphery is critical for its function, and we propose that BASL represents a plant-specific solution to the challenge of asymmetric cell division.


Figures

Figure 1
Figure 1. Phenotypes of basl Mutants
(A) Left: photomicrograph of developing leaf with stomatal lineage cell types indicated. MMC, meristemoid mother cell; M, meristemoid; GMC, guard mother cell; GC, guard cells; SLGC, stomatal lineage ground cell. Right: diagram of stomatal lineage with cell types color coded and asymmetric division types highlighted by blue shading. (B, C, and E–H) Confocal images of 3 dpg adaxial cotyledons. (B) WT. White braces indicate typical asymmetric divisions. (C) basl-2. White brackets indicate extra cell divisions and stomatal clusters. (D) Quantification of cells/0.25 mm2 region in 5 dpg adaxial cotyledons. Data are mean ± SD. * significant difference from the WT value (R software, α = 0.05). (E and F) Expression of TMMpro::GFP in the WT and basl-2, respectively. (G and H) Expression of MUTE::nucGFP (green) in WT and basl-2, respectively. Bracket in (H) indicates sister cells expressing MUTE::nucGFP. (I) Lineage tracing of the same cluster of basl-1 cells at 4, 5, and 6 dpg; red arrows indicate new division planes. Scale bars in (B) and (E) represent 50 µm; (B) and (C) are at the same scale, and (E) and (F) are at the same scale. The scale bar in (G) represents 25 µm; (G) and (H) are at the same scale. Cell outlines are visualized by Q8:GFP (Cutler et al., 2000) in (B), (C), and (I) and by propidium Iodide (PI) in (G) and (H).
Figure 2
Figure 2. BASL Gene Structure and Expression Pattern
(A) Hybrid gene/protein structure of BASL with exons indicated as boxes, the site of basl-1 mutation indicated by a vertical line, and sites of T-DNA alleles by triangles. The NLS and NES are indicated by black and gray shading, respectively. (B) Bright-field image of BASL::GUS expression pattern in 3-dpg adaxial cotyledon. Black arrows indicate meristemoids; black arrowheads indicate MMCs. (C) Confocal image of WT 3 dpg adaxial cotyledon. GFP-BASL is in green, and PI-marked cell outlines are in red. White arrowheads indicate BASL peripheral crescents, and the white arrow indicates GMC. Scale bars represent 50 µm.
Figure 3
Figure 3. Localization of BASL::GFP-BASL
(A–C) GFP-BASL in isolated MMCs or meristemoids. BASL may localize to the nucleus only (A), or to both the nucleus and in a crescent at the periphery (B and C). Polarized peripheral BASL can be seen in cells with a central (B) or asymmetrically positioned (C) nucleus. (D–F) BASL distribution after asymmetric cell division. Shortly after the division (new cell wall indicated by white arrow) BASL is initially both nuclear and peripheral in the larger daughter (D). Later, GFP-BASL is consistently bright at the periphery, but nuclear expression is diminished (E) or absent (F). (G–I) BASL localization in SLGCs located next to stomata. White arrowheads indicate BASL localization, and * indicates meristemoid position. Note that BASL crescent is consistently distal to new meristemoid. (G) WT with BASL crescent adjacent to GC. (H) Correctly oriented division in tmm-1; BASL crescent is adjacent to GC. (I) Incorrect division in tmm-1 with meristemoid adjacent to GC; BASL crescent is not adjacent to GC. (J–L′) Images of BASL in same cells captured at 60 hpg (J–L) and 72 hpg (J′–L′) illustrating terminal differentiation of both meristemoid and SLGC accompanied by loss of BASL from nucleus and periphery (J and J′, respectively), self-renewing division in smaller daughter cell results in asymmetric segregation of BASL to new daughters (K and K′), and spacing division in SLGC accompanied by a reorientation of the BASL crescent (L and L′, white arrowhead). Nuclear BASL in (L) is out of plane of focus, but can be seen in (L′) meristemoid. BASL::GFP-BASL signals are green, chloroplasts are blue, and cell outlines are counterstained with PI (A–I) or marked with pm-rk (J–L′) in red. Scale bars represent 10 µm; (J), (K), and (L) are at the same scale, and (J′), (K′), and (L′) are at the same scale.
Figure 4
Figure 4. Specific Domains of BASL Required for Localization and Function
(A) Diagram of BASL domains used in localization and rescue experiments. Black and gray boxes indicate NLS and NES positions. Numbers indicate amino acids included in the fragment. (B–F) Confocal images of BASL::GFP-BASL variants (green) in 3 dpg WT adaxial cotyledon. Cells are outlined with PI (red). (B) BASL-N in nuclei. White arrows point to nuclei of recently divided cells. (C) BASL-I in cytoplasm. White brackets indicate stomatal clusters and extra cells produced by expression of this domain in the WT. (D) BASL-IC in peripheral crescents (white arrowheads). (E) Rescue of basl-2 by expression of BASL-IC. (F) Failure to rescue basl-2 by expression of BASL-NI. Brackets indicate extra cells or stomatal clusters. (G) Quantification of rescue for BASL::GFP-BASL-IC. The y axis shows cells/0.25 mm2 region in 4 dpg adaxial cotyledons. (H) Quantification of rescue for BASL::GFP-BASL-NI. The y axis shows cells/0.06 mm2 region in 3 dpg adaxial cotyledons. Data are shown as mean ± SD. * indicates significant difference from basl-2 value (R software, α = 0.05). Scale bars in (B), (C), and (E) represent 25 µm; (B) and (D) are at the same scale, and (E) and (F) are at the same scale.
Figure 5
Figure 5. BASL and BASL-IC Overexpression Phenotypes and ROP2 Regulation
Overexpression of BASL (A–C) and BASL-IC (D–F) phenotypes in 7 dpg petioles and hypocotyl, respectively. (A) DIC image of a WT petiole. (B) DIC image of 35S::GFP-BASL. Note the production of ectopic cell outgrowths (arrowheads). (C) Fluorescent image of 35S::GFP-BASL in the same plane as (B). Outgrowths correlate with local accumulation of BASL (arrowheads). (D and E) DIC image of WT and 35S::GFP-BASL-IC in 7 dpg hypocotyls, respectively. (F) Fluorescent image of 35S::GFP-BASL-IC in the same plane as (E). Cell outlines were traced with dotted lines and illustrated on the right corners of DIC images. (G–L) Confocal images of 5 dpg hypocotyls. WT (G), CA-rop2 (H), DN-rop2 (I), and 35S::GFP-BASL overexpression in WT (J), CA-rop2 (K), and DN-rop2(L) are shown. GFP-BASL shown in green. Cells are outlined with PI (red). Scale bars in (A) and (G) represent 50 µm; (A)–(F) are at the same scale, and (G)–(L) are at the same scale.
Figure 6
Figure 6. Localization of BASL and PIN Proteins in Roots
Confocal images of 3 dpg roots expressing 35S::GFP-BASL (A and D), PIN1pro::PIN1-GFP (B and E), and PIN2pro::PIN2-GFP(C and F). White boxed areas in (A)–(C) are enlarged in (D)–(F). In (D)–(F), white arrows mark nuclear BASL, and white arrowheads indicate polarized peripheral accumulation of BASL (D), PIN1 (E), and PIN2 (F). Dashed outlines surround cells associated with polarized PINs (arrowheads in E and F). The scale bar in (A) represents 50 µm; (A)–(C) are at same scale.
Figure 7
Figure 7. Model for BASL Function in Stomatal Lineage Asymmetric Divisions
BASL localization in the nucleus and at the periphery correlates with specific cell behaviors. BASL becomes polarized before cell division in asymmetrically dividing cells, and we hypothesize that an initial expanding region is coincident with BASL polarized localization, thus ensuring that the BASL crescent is distal to the nucleus and segregated to the larger daughter cell. In the smaller daughter of an asymmetric division, BASL is nuclear. If BASL is only nuclear, this cell will differentiate into a GMC and eventually a pair of guard cells. If the cell retains BASL in both the nucleus and periphery, this cell will continue to divide as a MMC or M. In the larger (SLGC) daughter, BASL moves to the periphery in a region distal to the division plane. If this cell retains nuclear and peripheral BASL, it will divide asymmetrically; if it loses nuclear BASL, it will differentiate into a pavement cell. Mature pavement cells that retain BASL restrict it to one lobe. In SLGCs next to stomata, the peripheral BASL crescents must reorient prior to another asymmetric division to preserve the one-cell-spacing rule.

Similar articles

Cited by

References

    1. Arabidopsis Genome Initiative. Analysis of the genome sequence of the flowering plant Arabidopsis thaliana. Nature. 2000;408:796–815. - PubMed
    1. Benkova E, Michniewicz M, Sauer M, Teichmann T, Seifertova D, Jurgens G, Friml J. Local, efflux-dependent auxin gradients as a common module for plant organ formation. Cell. 2003;115:591–602. - PubMed
    1. Bergmann DC, Sack FD. Stomatal development. Annu. Rev. Plant Biol. 2007;58:163–181. - PubMed
    1. Bergmann DC, Lukowitz W, Somerville CR. Stomatal development and pattern controlled by a MAPKK kinase. Science. 2004;304:1494–1497. - PubMed
    1. Betschinger J, Mechtler K, Knoblich JA. Asymmetric segregation of the tumor suppressor brat regulates self-renewal in drosophila neural stem cells. Cell. 2006;124:1241–1253. - PubMed

Publication types