Review
. 2009 Jun 10;17(6):869-81.
doi: 10.1016/j.str.2009.03.015.

PSI-2: structural genomics to cover protein domain family space

Affiliations
Review

PSI-2: structural genomics to cover protein domain family space

Benoît H Dessailly et al. Structure. .

Abstract

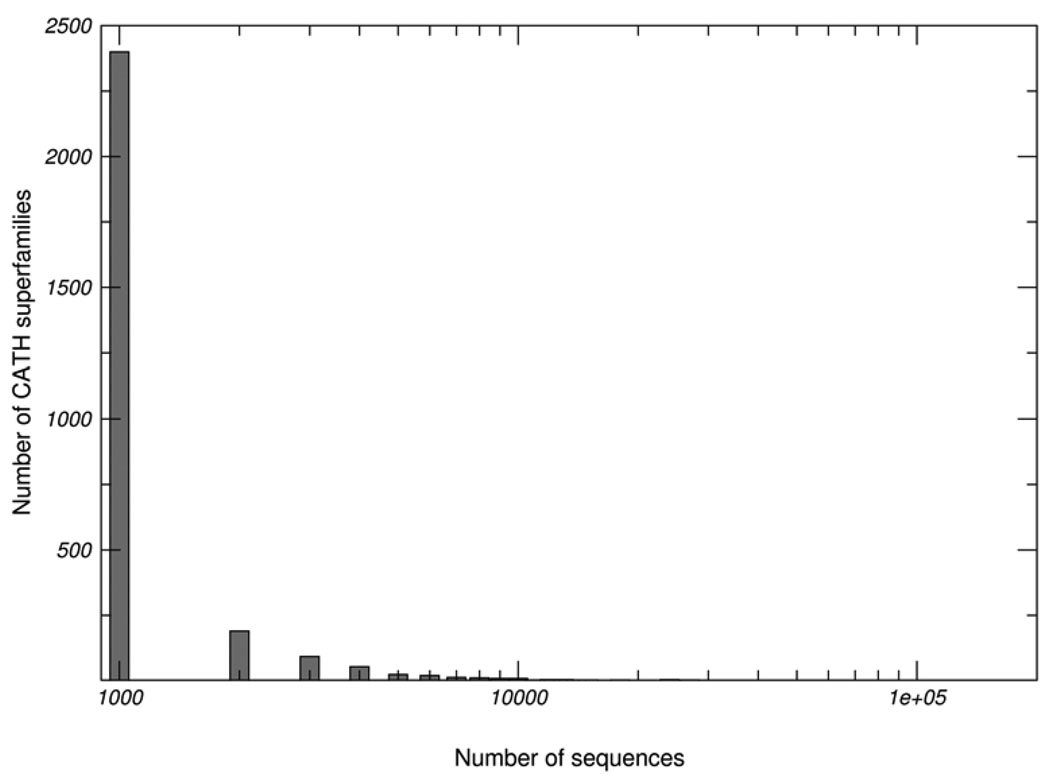
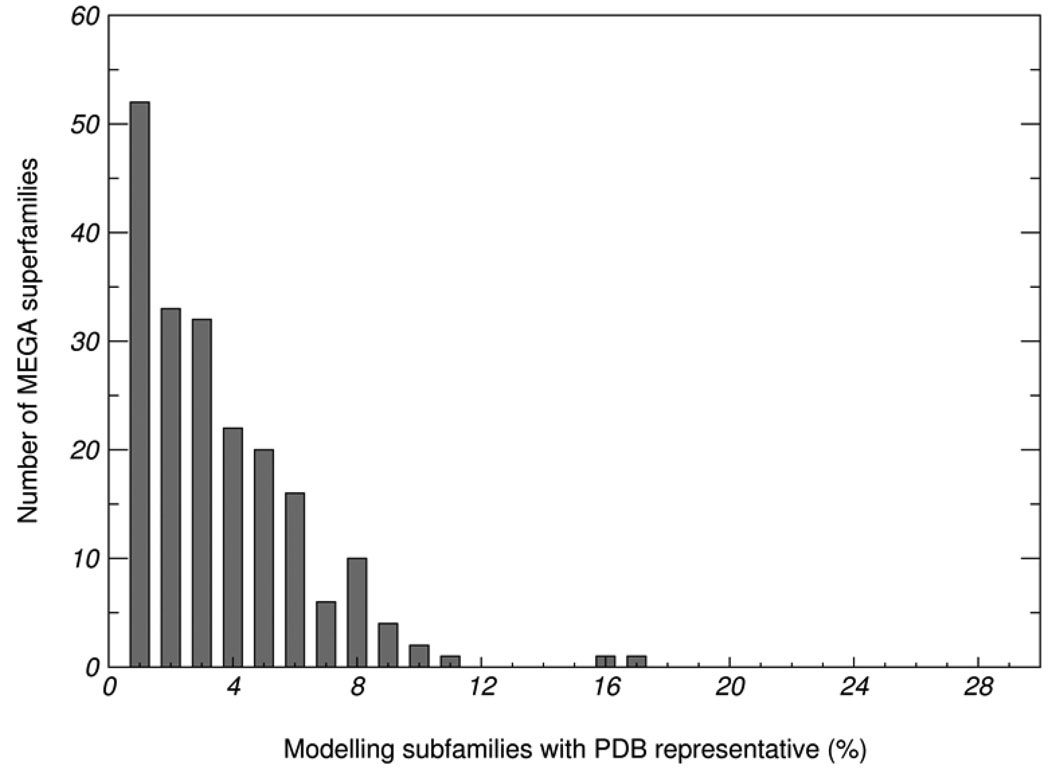
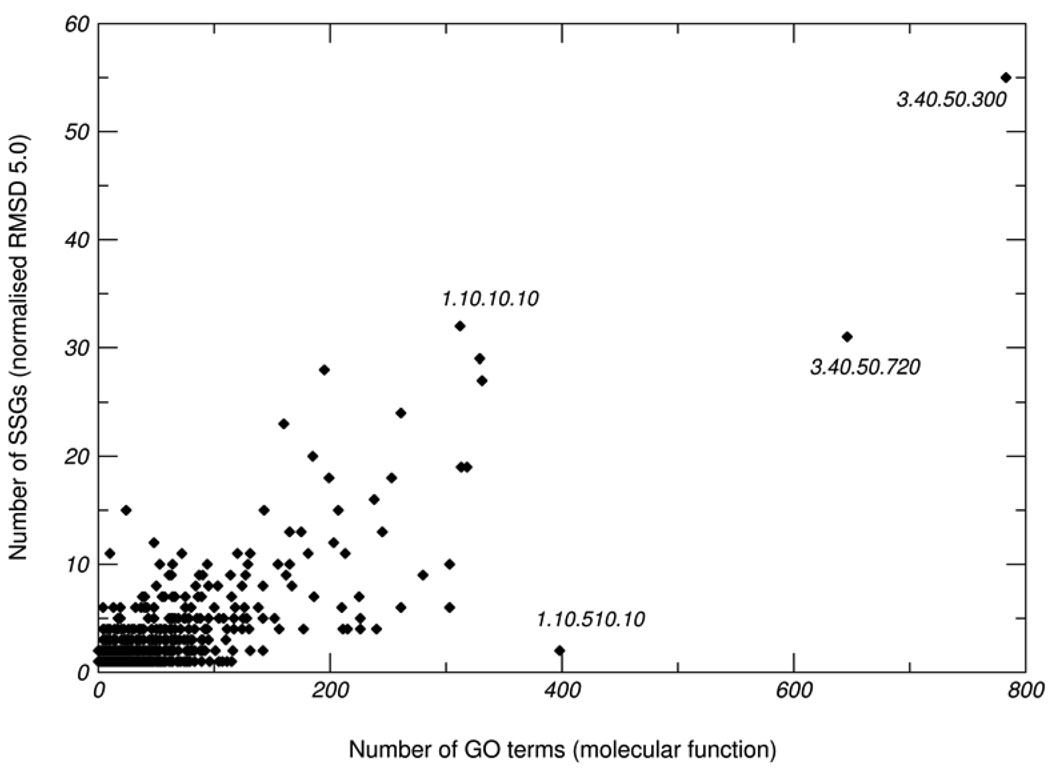
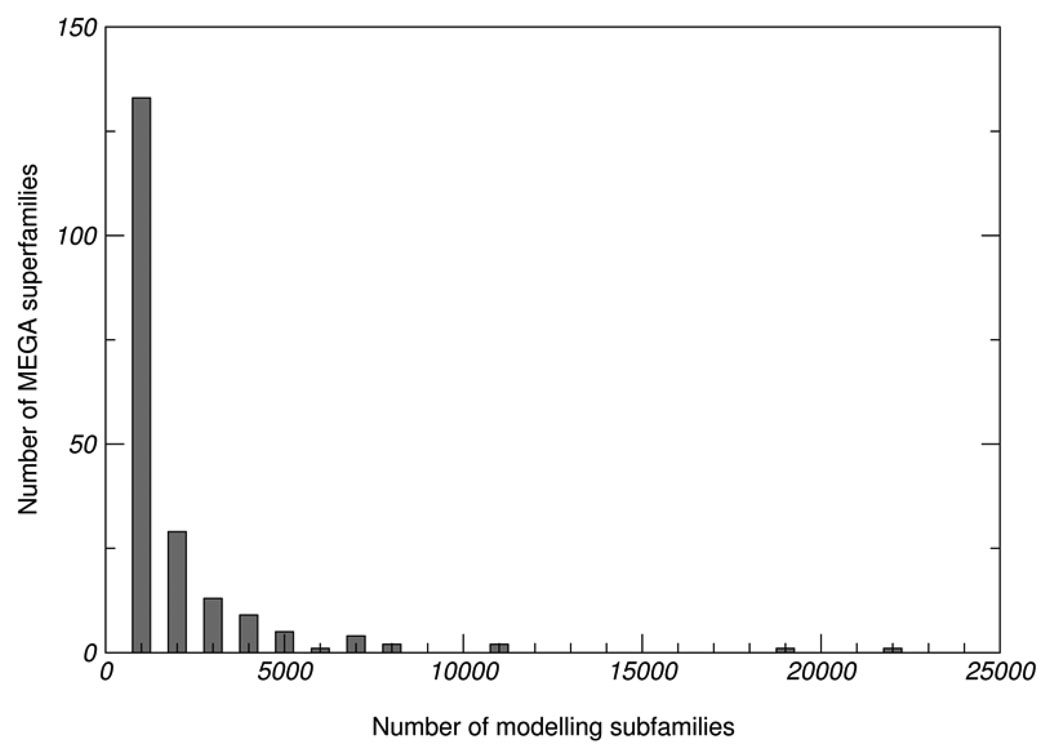
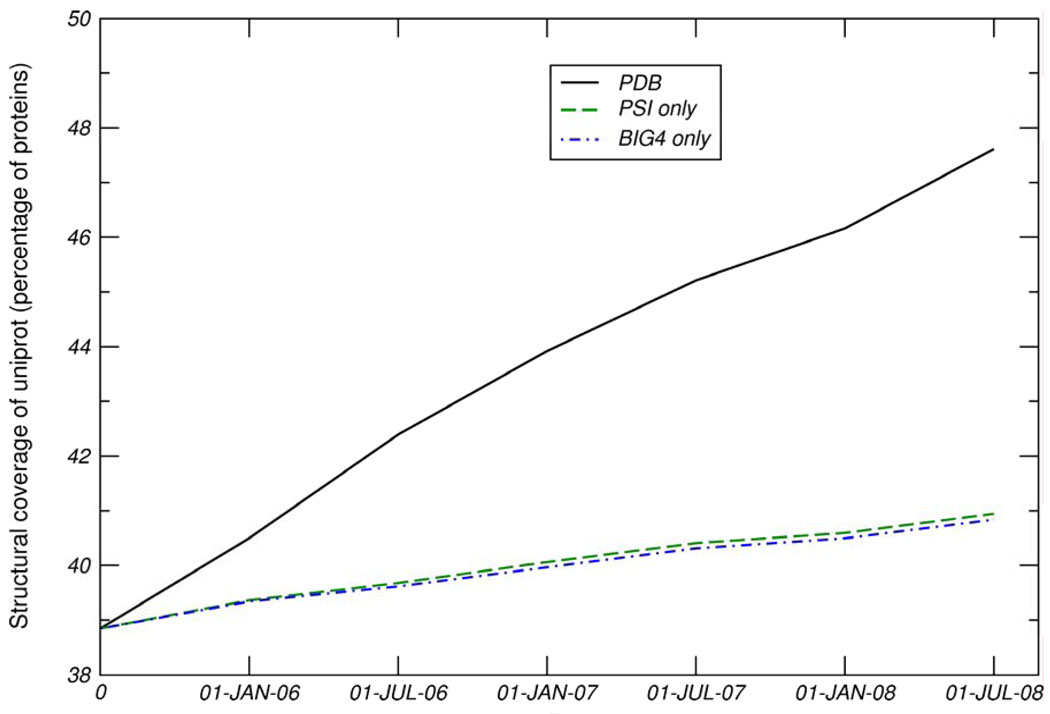
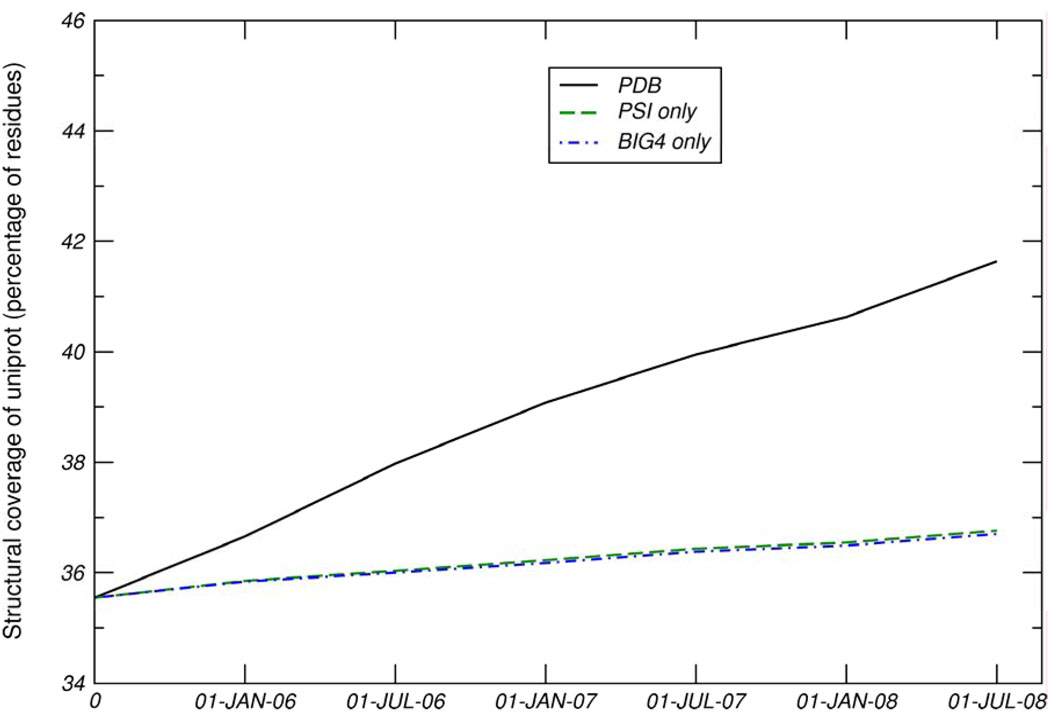
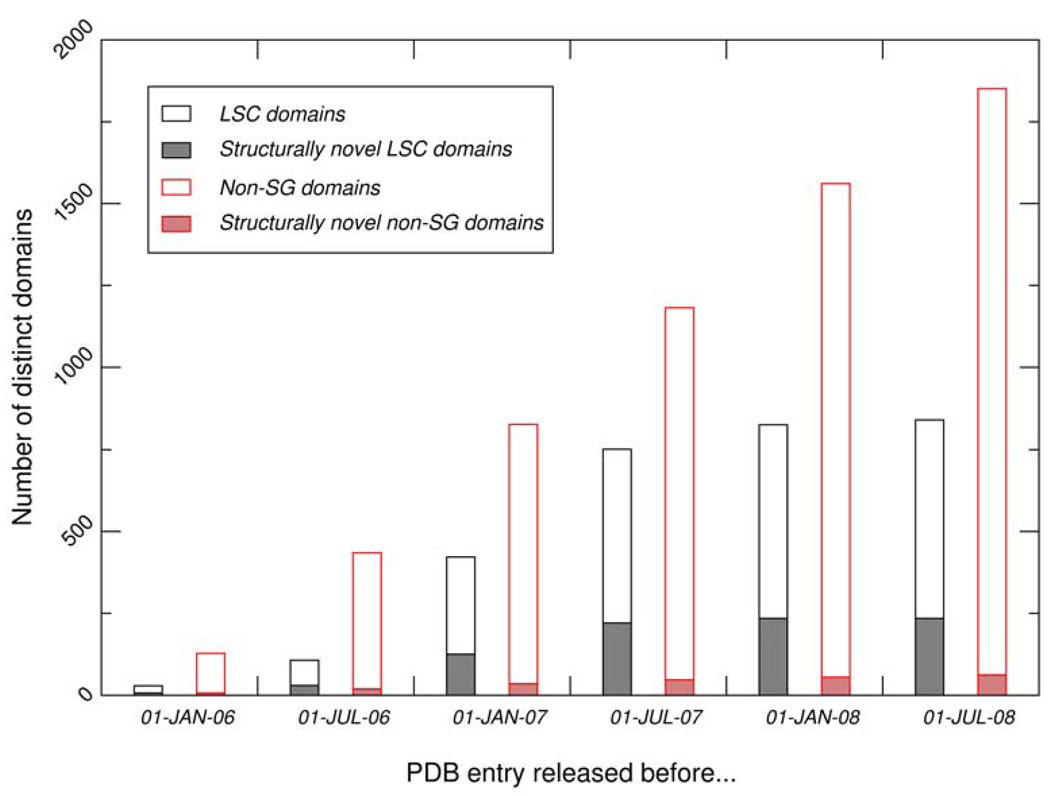
One major objective of structural genomics efforts, including the NIH-funded Protein Structure Initiative (PSI), has been to increase the structural coverage of protein sequence space. Here, we present the target selection strategy used during the second phase of PSI (PSI-2). This strategy, jointly devised by the bioinformatics groups associated with the PSI-2 large-scale production centers, targets representatives from large, structurally uncharacterized protein domain families, and from structurally uncharacterized subfamilies in very large and diverse families with incomplete structural coverage. These very large families are extremely diverse both structurally and functionally, and are highly overrepresented in known proteomes. On the basis of several metrics, we then discuss to what extent PSI-2, during its first 3 years, has increased the structural coverage of genomes, and contributed structural and functional novelty. Together, the results presented here suggest that PSI-2 is successfully meeting its objectives and provides useful insights into structural and functional space.


Figures

Figure 1
Figure 1
Distribution of numbers of sequences from Gene3D v6.0 (Yeats et al., 2008) for all CATH superfamilies (Greene et al., 2007).
Figure 2
Figure 2
Proportion of structurally characterized modelling sub-families in very large and diverse families (referred to as MEGA families). MEGA families are the 200 largest superfamilies in CATH, and taken together they represent more than 50% of domains in genome sequences. These families are typically very diverse in terms of structure and function.
Figure 3
Figure 3
Correlation between structural and functional diversity in CATH superfamilies. For each superfamily, the x-axis gives the number of molecular function GO terms identified for members of that superfamily in Gene3D. The y-axis gives the number of structurally similar sub-groups (see Methods) obtained by clustering domains from the superfamily with a normalised RMSD cut-off of 5Å.
Figure 4
Figure 4
Number of modelling families in 200 very large and diverse CATH superfamilies.
Figure 5
Figure 5
Increase in the fraction of proteins (a) and residues (b) from UniProt (release 12.8), that can be structurally modelled using structures released in the PDB since the start of PSI-2. The black line shows the increase in structural coverage resulting from all structures released in the PDB, the green line shows the increase resulting from PSI-2 structures only, and the blue line shows the increase resulting exclusively from structures solved by the PSI-2 large-scale centres.
Figure 5
Figure 5
Increase in the fraction of proteins (a) and residues (b) from UniProt (release 12.8), that can be structurally modelled using structures released in the PDB since the start of PSI-2. The black line shows the increase in structural coverage resulting from all structures released in the PDB, the green line shows the increase resulting from PSI-2 structures only, and the blue line shows the increase resulting exclusively from structures solved by the PSI-2 large-scale centres.
Figure 6
Figure 6
Structural novelty of structural domains solved by PSI-2 large-scale centres (‘LSC’) and traditional structural biology worldwide (excluding Structural Genomics structures) between June 2005 and June 2008. Only domains classified in CATH are considered in this plot.

Similar articles

Cited by

References

    1. Altschul SF, Gish W, Miller W, Myers EW, Lipman DJ. Basic local alignment search tool. J. Mol. Biol. 1990;215:403–410. - PubMed
    1. Altschul SF, Madden TL, Schaffer AA, Zhang J, Zhang Z, Miller W, Lipman DJ. Gapped BLAST and PSI-BLAST: a new generation of protein database search programs. Nucleic Acids Res. 1997;25:3389–3402. - PMC - PubMed
    1. Aravind L, Anantharaman V, Koonin EV. Monophyly of class I aminoacyl tRNA synthetase, USPA, ETFP, photolyase, and PP-ATPase nucleotide-binding domains: implications for protein evolution in the RNA. Proteins. 2002;48:1–14. - PubMed
    1. Berman HM, Westbrook J, Feng Z, Gilliland G, Bhat TN, Weissig H, Shindyalov IN, Bourne PE. The Protein Data Bank. Nucleic Acids Res. 2000;28:235–242. - PMC - PubMed
    1. Berman HM, Westbrook JD, Gabanyi MJ, Tao W, Shah R, Kouranov A, Schwede T, Arnold K, Kiefer F, Bordoli L, Kopp J, Podvinec M, Adams PD, Carter LG, Minor W, Nair R, La BJ. The protein structure initiative structural genomics knowledgebase. Nucleic Acids Res. 2009;37:D365–D368. - PMC - PubMed

Publication types