

Sampling the spatial patterns of cancer: optimized biopsy procedures for estimating prostate cancer volume and Gleason Score
- PMID: 19524478
- PMCID: PMC2748333
- DOI: 10.1016/j.media.2009.05.002
Sampling the spatial patterns of cancer: optimized biopsy procedures for estimating prostate cancer volume and Gleason Score
Abstract
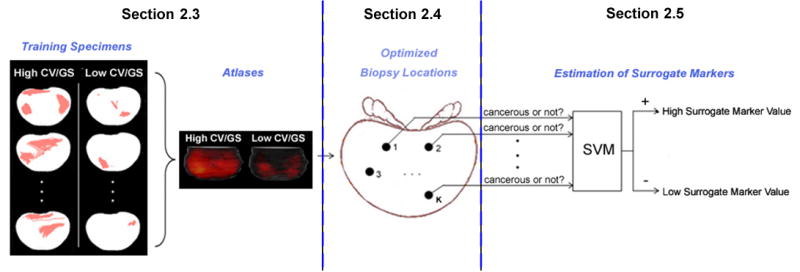
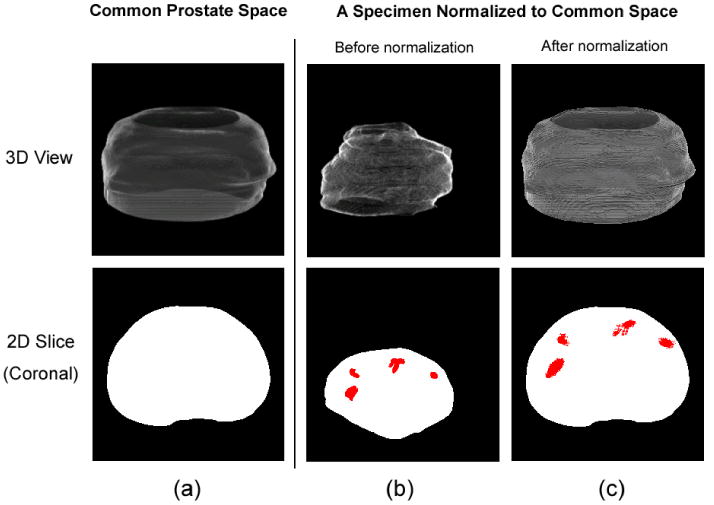
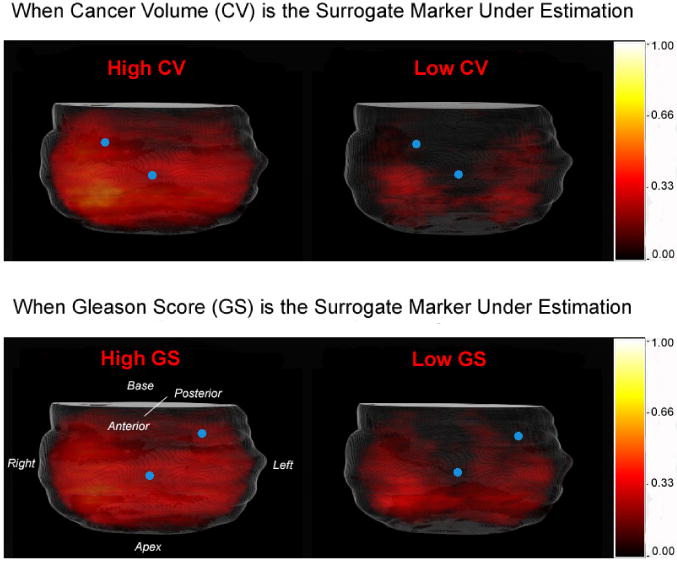
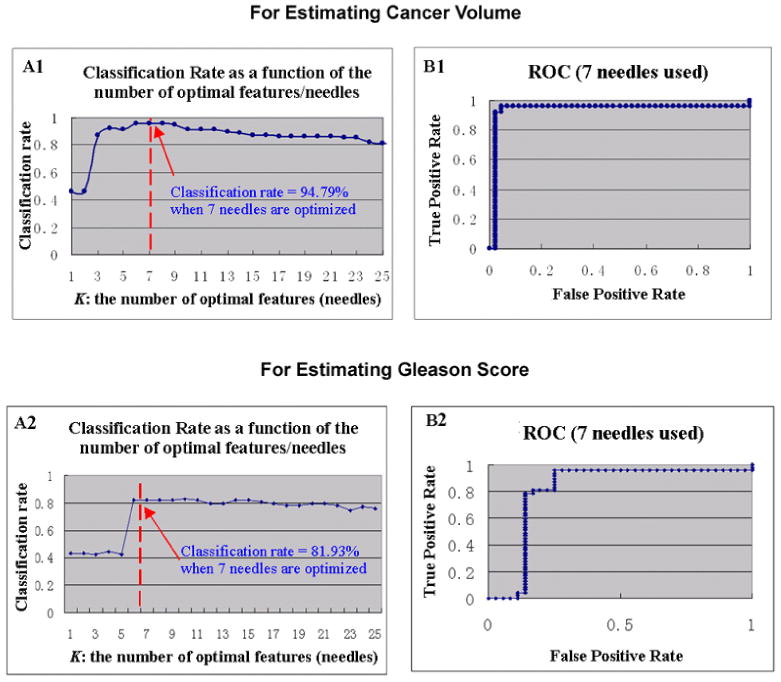
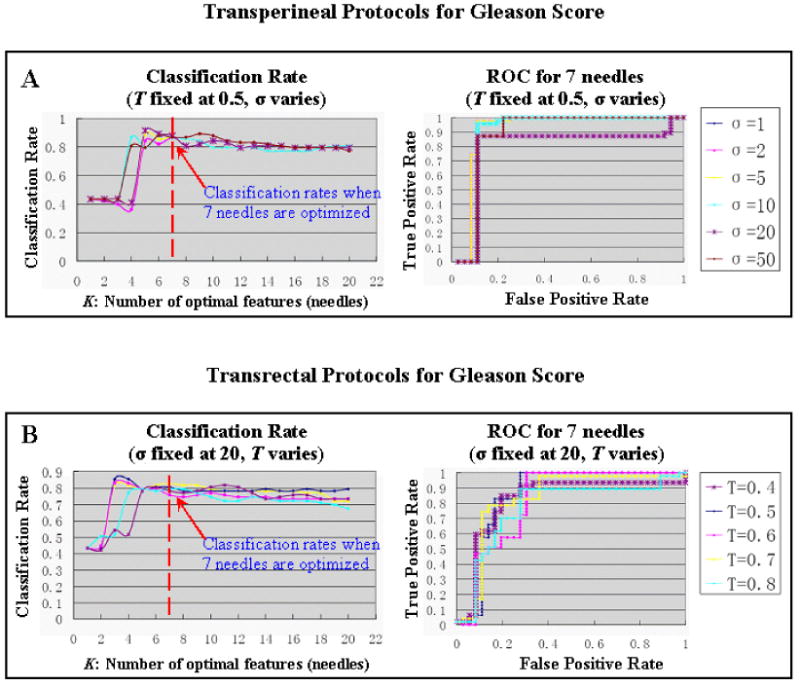
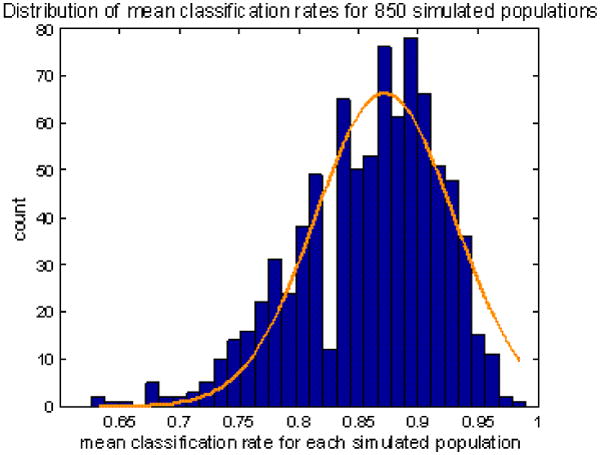
Prostate biopsy is the current gold-standard procedure for prostate cancer diagnosis. Existing prostate biopsy procedures have been mostly focusing on detecting cancer presence. However, they often ignore the potential use of biopsy to estimate cancer volume (CV) and Gleason Score (GS, a cancer grade descriptor), the two surrogate markers for cancer aggressiveness and the two crucial factors for treatment planning. To fill up this vacancy, this paper assumes and demonstrates that, by optimally sampling the spatial patterns of cancer, biopsy procedures can be specifically designed for estimating CV and GS. Our approach combines image analysis and machine learning tools in an atlas-based population study that consists of three steps. First, the spatial distributions of cancer in a patient population are learned, by constructing statistical atlases from histological images of prostate specimens with known cancer ground truths. Then, the optimal biopsy locations are determined in a feature selection formulation, so that biopsy outcomes (either cancer presence or absence) at those locations could be used to differentiate, at the best rate, between the existing specimens having different (high vs. low) CV/GS values. Finally, the optimized biopsy locations are utilized to estimate whether a new-coming prostate cancer patient has high or low CV/GS values, based on a binary classification formulation. The estimation accuracy and the generalization ability are evaluated by the classification rates and the associated receiver-operating-characteristic (ROC) curves in cross validations. The optimized biopsy procedures are also designed to be robust to the almost inevitable needle displacement errors in clinical practice, and are found to be robust to variations in the optimization parameters as well as the training populations.
Figures
Similar articles
-
Targeted prostate biopsy using statistical image analysis.IEEE Trans Med Imaging. 2007 Jun;26(6):779-88. doi: 10.1109/TMI.2006.891497. IEEE Trans Med Imaging. 2007. PMID: 17679329
-
High-throughput detection of prostate cancer in histological sections using probabilistic pairwise Markov models.Med Image Anal. 2010 Aug;14(4):617-29. doi: 10.1016/j.media.2010.04.007. Epub 2010 Apr 29. Med Image Anal. 2010. PMID: 20493759 Free PMC article.
-
Automated detection of prostatic adenocarcinoma from high-resolution ex vivo MRI.IEEE Trans Med Imaging. 2005 Dec;24(12):1611-25. doi: 10.1109/TMI.2005.859208. IEEE Trans Med Imaging. 2005. PMID: 16350920 Clinical Trial.
-
Multifeature prostate cancer diagnosis and Gleason grading of histological images.IEEE Trans Med Imaging. 2007 Oct;26(10):1366-78. doi: 10.1109/TMI.2007.898536. IEEE Trans Med Imaging. 2007. PMID: 17948727
-
Three-dimensional sonography with needle tracking: role in diagnosis and treatment of prostate cancer.J Ultrasound Med. 2008 Jun;27(6):895-905. doi: 10.7863/jum.2008.27.6.895. J Ultrasound Med. 2008. PMID: 18499849 Free PMC article. Review.
Cited by
-
Prostate focused ultrasound focal therapy--imaging for the future.Nat Rev Clin Oncol. 2012 Dec;9(12):721-7. doi: 10.1038/nrclinonc.2012.136. Epub 2012 Aug 21. Nat Rev Clin Oncol. 2012. PMID: 22910682 Review.
-
A statistical, voxelised model of prostate cancer for biologically optimised radiotherapy.Phys Imaging Radiat Oncol. 2022 Mar 6;21:136-145. doi: 10.1016/j.phro.2022.02.011. eCollection 2022 Jan. Phys Imaging Radiat Oncol. 2022. PMID: 35284663 Free PMC article.
-
Deformable MRI-Ultrasound registration using correlation-based attribute matching for brain shift correction: Accuracy and generality in multi-site data.Neuroimage. 2019 Nov 15;202:116094. doi: 10.1016/j.neuroimage.2019.116094. Epub 2019 Aug 22. Neuroimage. 2019. PMID: 31446127 Free PMC article.
-
Comparison of diagnostic efficacy between transrectal and transperineal prostate biopsy: A propensity score-matched study.Asian J Androl. 2019 Nov-Dec;21(6):612-617. doi: 10.4103/aja.aja_16_19. Asian J Androl. 2019. PMID: 31006712 Free PMC article.
-
COMPUTER-AIDED GLEASON GRADING OF PROSTATE CANCER HISTOPATHOLOGICAL IMAGES USING TEXTON FORESTS.Proc IEEE Int Symp Biomed Imaging. 2010 Apr 17;14-17 April 2010:636-639. doi: 10.1109/ISBI.2010.5490096. Proc IEEE Int Symp Biomed Imaging. 2010. PMID: 21221421 Free PMC article.
References
-
- Cancer Facts and Figures. Atlanta: American Cancer Society; 2008. http://www.cancer.org.
-
- Akin O, Hricak H. Imaging of prostate cancer. Radiol Clin North Am. 2007;45:207–222. - PubMed
-
- Albertsen P. Defining clinically significant prostate cancer: pathologic criteria versus outcomes data. Journal of the National Cancer Institute. 1996;88:1177–1178. - PubMed
-
- Burges C. A tutorial on support vector machines for pattern recognition. Data Mining and Knowledge Discovery. 1998;2:121–167.
MeSH terms
Grants and funding
LinkOut - more resources
Full Text Sources
Other Literature Sources
Medical
