

Review
doi: 10.1016/j.neuron.2009.05.015.
Neurons that fire together also conspire together: is normal sleep circuitry hijacked to generate epilepsy?
Affiliations
- PMID: 19524522
- PMCID: PMC2748990
- DOI: 10.1016/j.neuron.2009.05.015
Item in Clipboard
Review
Neurons that fire together also conspire together: is normal sleep circuitry hijacked to generate epilepsy?
Neuron.
.
Abstract
Brain circuits oscillate during sleep. The same circuits appear to generate pathological oscillations. In this review, we discuss recent advances in our understanding of how epilepsy co-opts normal, sleep-related circuits to generate seizures.
Figures

EEG recordings of sleep spindles (A) and spike-wave discharges (B) from the same patient. A1. A 10 Hz low-amplitude spindle oscillation lasting two seconds was recorded on all 4 channels during stage 2 sleep (demarked by the horizontal bar). B1. EEG activity during an absence seizure as evidenced by the hallmark 3 Hz spike-wave discharge on all 4 channels. Traces correspond to same 4 channels recorded in A. A2 & B2. The section of recordings demarcated by the line below the bottom trace of A1/B1 is expanded in A2/B2. Note the change in vertical gain. EEGs are biopolar recordings and were placed according to the Standard International 10-20 System of Electrode Placement with a transverse montage crossing midline. EEG recordings courtesy of Dr. Kevin Graber, Stanford University Epilepsy Center.

Schematic representation of RT-TC circuitry present in thalamic brain slices. A. Putative spindle generator. Anatomy (left). Shown is one pair of reciprocally-connected RT and TC neurons. RT neurons are GABAergic and inhibit TC neurons via GABAA and GABAB postsynaptic receptors. TC neurons are glutamatergic and excite RT neurons (and cortical neurons). Not shown are the corticothalamic inputs to that are proposed to activate spindle rhythm generator. Oscillations (right). Following RT-mediated inhibition, TC neurons generate post-inhibitory rebound action potential bursts. These TC burst are responsible for recurrent excitation of RT neurons and activation of the subsequent cycle of the oscillation. Both RT and TC bursting activity is mediated by T-type Ca2+ channel activity. Plus signs (+) refer to glutamatergic excitation while minus signs (-) refer to GABAergic inhibition. B. Mechanisms that contribute to the synchronization and desynchronization of RT neuron activity. Electrical coupling among RT neurons is hypothesized to synchronize their activity. RT-to-RT neuron inhibition (i.e. intra-RT inhibition) is proposed to desynchronize RT neuron activity through a burst-shunting mechanism (Sohal and Huguenard, 2003). For example, if RT2 fires slightly before RT1 & RT3, then RT1 & RT3 will not fire bursts of activity. Moreover, if the inhibition is sufficiently strong, then recurrent excitation by TC neurons will be ineffective at triggering a subsequent burst in RT1 & RT3. Also shown is the convergence/divergence of RT-to-TC and TC-to-RT connectivity. Line thickness/synapse size does not represent functional difference in connection strength.

Proposed relationship between sleep spindle oscillation and the slow cortical oscillation. A. The slow cortical oscillation is generated in the cortex. The spindle rhythm generator is found in the thalamus. B. As proposed by Contreras and Steriade (1995) and Steriade et al. (1993a, cortical activity generated during the slow oscillation is transmitted to the thalamic reticular nucleus and activates the spindle rhythm generator. Spindle activity generated in the thalamus is then relayed back to cortex by thalamocortical neurons. High levels of cortical activity are represented by the plus (+) signs which occur at the peaks of the cortical oscillation (vertical dotted line).

Schematic representation of the hippocampus and the sharp-wave ripple complex. Left. In general, the flow of information begins in the dentate gyrus, proceeds to CA3, then to CA1 and finally to the subiculum. The sharp wave component of the sharp-wave complex is hypothesized to involve the synchronized busting of many CA3 pyramidal neurons. The excitation provided by CA3 pyramidal neurons is then transmitted to CA1 where subsequent ripple activity is generated. While CA1 ripple activity is hypothesized to emanate from CA1 pyramidal neurons, it is not clear what mechanisms contribute to the generation of the activity. Right. The composite sharp-wave ripple complex in schematic form.
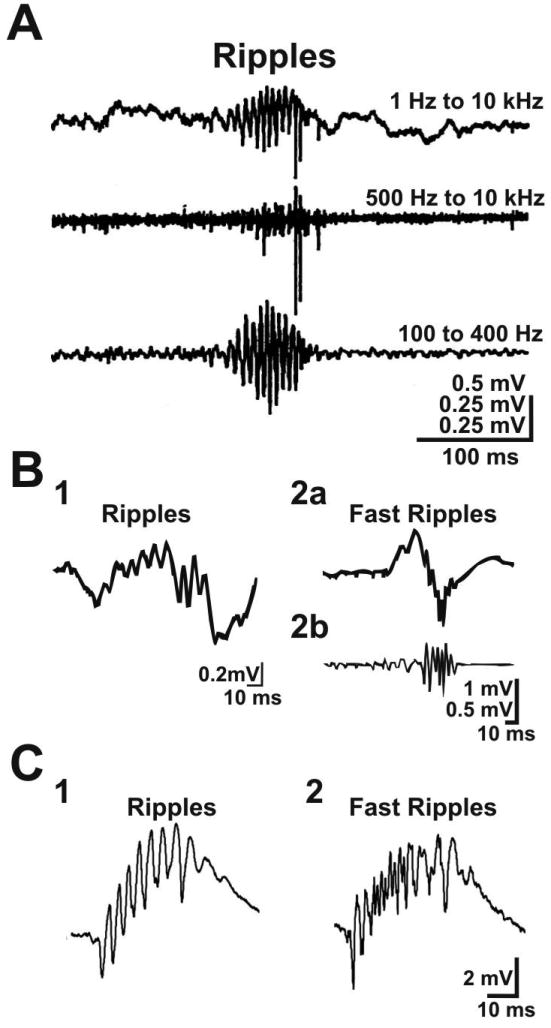
Electrophysiological recordings of ripple and fast ripple activity. A. Ripple oscillation recorded by Buzsaki et al. (1992) in area CA1 of rat hippocampus. The 3 traces correspond to the same recording filtered with 3 different settings. The 200 Hz oscillation is clearly observed when the signal is bandpass filtered between 100 and 400 Hz (bottom trace). B. Ripple (1) and fast ripple (2) oscillations recorded by Staba et al. (2007) with microelectrodes placed in the hippocampus of a human patient with MTLE. Shown are unfiltered (B2a) and bandpass filtered (B2b, filter = 70-600 Hz) fast ripple oscillations. C. Ripple (1) and fast ripple (2) oscillations recorded by Foffani et al. (2007) in hippocampal brain slices of control (1) and epileptic (2) rat. Figure credits. Part A from Buzsaki et al. (1992). Reprinted with permission from AAAS. Part B from Staba et al. (2007) with permission from Wiley. Part C from Foffani et al. (2007) with permission from Elsevier. Original figures were slightly modified.

Schematic representation of important experimental observations associated with ripple oscillations. A. Components that contribute to ripple oscillations. Consensus exists that the sharp wave produced by CA3 pyramidal neurons (blue) provides the excitatory drive that initiates the ripple oscillation. Also, it is generally accepted that rhythmic inhibition of CA1 pyramidal neurons (red) underlies ripple oscillations recorded in vivo. What is not clear is how such rhythmic inhibition arises (black box). One hypothesis suggests that rhythmogenic inhibitory networks provide input to CA1 pyramidal neurons (see Figure 7), while another argues that electrically coupled CA1 pyramidal neuron axons form the substrate for rhythmicity (see Figure 8). B. Graphical representation of observed activity patterns during ripple oscillation. Vertical lines placed on horizontal black lines represent extracellularly recorded action potentials of CA3 (blue) and CA1 (red) pyramidal neurons, and CA1 inhibitory neurons (green). The bottom red traces represent synaptic activity of an intracellularly recorded CA1 pyramidal neuron. Before the sharp wave all neurons are weakly active and synaptic activity observed in the CA1 pyramidal neuron is low (left panel). During the sharp wave CA3 pyramidal neurons fire highly synchronized bursts of action potentials, resulting in a moderate elevation of activity in CA1 pyramidal and inhibitory neurons. The sharp wave also causes a CA1 ripple oscillation, which is hypothesized to result from the fast rhythmic inhibition of CA1 pyramidal neurons.

Graphical description of how inhibitory networks may provide the rhythmicity that underlies ripple oscillations. A1. Placing the computational models proposed by Brunel and Wang (2003) and Geisler et al. (2005) in a hippocampal context, the aggregate activity of CA1 inhibitory neurons (green) provides rhythmic drive to CA1 pyramidal neurons (red). As such, local inhibitory networks in CA1 are hypothesized to function as the rhythm generator for ripple oscillations. Excitation provided by CA3 pyramidal neurons (blue) activates CA1 inhibitory networks. A2. Description of the temporal relationship between CA1 network dynamics and ripple oscillations, as represented by a rhythmic 200 Hz local field potential (LFP). Excitation from CA3 activates CA1 inhibitory neurons. CA1 inhibitory neuron activity is low at the LFP trough and progressively increases in response to CA3 excitation. Concomitant with the increase in inhibitory neuron activity is a strengthening of recurrent inhibition within the network. At the LFP peak, recurrent inhibition is strong and overpowers the CA3 excitatory drive. This causes the activity levels among CA1 inhibitory neurons to decrease. The 5 msec period of the LFP is defined by synaptic delays and rise times associated with inhibitory events. B. Graphical representation of neuronal activity patterns according to proposed model. As in Figure 6, vertical lines placed on horizontal time lines represent extracellularly recorded action potentials. The black trace corresponds to the LFP and the red traces represent synaptic activity of an intracellularly recorded CA1 pyramidal neuron. During the sharp wave activity levels of individual CA1 inhibitory neurons are not obviously rhythmic. However, rhythmicity is apparent when summating the activity across all individual neurons (CA1pop.). As described in A2, high-frequency population activity is observed at the LFP peak while low-frequency activity is observed at the LFP trough. CA1 pyramidal neurons receive fast rhythmic inhibition because the activity generated by the inhibitory networks is oscillatory.

Graphical description of how electrical coupling among the axons of CA1 pyramidal neurons may provide the rhythmicity that underlies ripple oscillations. A1. As proposed by Traub and colleagues, propagating activity within a plexus of electrically coupled CA1 pyramidal neuron axons forms the basis of the rhythm generator for ripple oscillations. The plexus is activated by CA3 excitatory input. By rhythmically driving CA1 inhibitory neurons (see B), the activated plexus indirectly generates rhythmic IPSPs on somatic regions of CA1 pyramidal neurons. A2. Description of the temporal relationship between CA1 axon plexus dynamics and ripple oscillations, as represented by a rhythmic 200 Hz local field potential (LFP). The plexus is arbitrarily composed of 30 axons (red) that can be subdivided into 10 nodes according to firing times. Numbers above the plexus represent node number. Nodes 1 & 10 contain 1 axon each, nodes 2 & 9 contain 2 axons each, and nodes 3-8 contain 4 axons each. Axons within each node fire action potentials at the same time. The axon in node 1 is electrically coupled to both axons in node 2, which, in turn, are electrically coupled to the axons in node 3, and so forth. Thus, when an action potential is spontaneously generated by the axon in node 1, the activity quickly propagates through the plexus in a wave-like manner (from left to right). The duration of the wave is determined by the time for an action potential to cross a gap junction and the size of the plexus (specifically, the number of nodes through which the wave propagates). For practical reasons, in this example we define the duration for an action potential to propagate through a gap junction to equal 0.5 msec (it is proposed to be slightly briefer). Because the activity propagates through 10 nodes, the duration of the wave is equal to 5 msec (0.5 msec × 10 nodes). Once the wave of activity terminates, another wave begins when the next spontaneously-generated action potential occurs within the plexus (which we arbitrarily set to occur again within node 1). During CA3-mediated excitation, the rate of spontaneously-generated action potentials within the plexus is high, resulting in propagating waves that occur every ∼5 msec (i.e. time-locked to the local field potential, LFP). B. Proposed mechanism for how activity generated by the CA1 pyramidal neuron axon plexus results in rhythmic perisomatic inhibition of CA1 pyramidal neurons. For simplicity, we show only two CA1 pyramidal neurons and two inhibitory neurons. Under normal conditions action potentials generated within the axon plexus propagate orthodromically to trigger the release of glutamate that excites inhibitory neurons. The inhibitory neurons are rhythmically activated because the output of the plexus is rhythmic. Inhibitory neurons, in turn, rhythmically inhibit the perisomatic region of CA1 pyramidal neurons, resulting in ripple oscillations. Under conditions that block chemical neurotransmission the rhythmic waves of activity within the axon plexus persist. However, because communication between pyramidal and inhibitory neurons is abolished, the recorded ripple oscillation is a consequence of action potentials propagating antidromically back to the CA1 pyramidal neuron soma. C. Graphical representation of neuronal activity patterns according to proposed model. As in Figure 6, vertical lines placed on horizontal black lines represent extracellularly recorded action potentials. The two bottom red traces represent synaptic activity of intracellularly recorded CA1 pyramidal neurons and the bottom trace corresponds to the LFP. Population activity within the CA1 axon plexus (red, represented as a histogram) is rhythmic during the CA3 sharp wave (blue). The plexus rhythmically activates a population of CA1 inhibitory neurons (CA1pop., green), resulting in rhythmic IPSPs in the perisomatic region of CA1 pyramidal neurons (bottom red traces).
References
-
- Alzheimer C, Sutor B, ten Bruggencate G. Transient and selective blockade of adenosine A1-receptors by 8-cyclopentyl-1,3-dipropylxanthine (DPCPX) causes sustained epileptiform activity in hippocampal CA3 neurons of guinea pigs. Neuroscience Letters. 1989;99:107–112. - PubMed
-
- Alzheimer C, Sutor B, Ten Bruggencate G. Disinhibition of hippocampal CA3 neurons induced by suppression of an adenosine A1 receptor-mediated inhibitory tonus: Pre- and postsynaptic components. Neuroscience. 1993;57:565–575. - PubMed
-
- Andersen P, Andersson S, Junge K, Sveen O. Xth Scandinavian EEG meeting: Voksenåsen, Oslo, Norway March 10-11, 1967 Secretary: C. W. Sem-Jacobsen The EEG Research Institute, Gaustad Sykehus, Oslo 3 (Norway) Electroencephalography and Clinical Neurophysiology. 1968;24:87–92.
Publication types
MeSH terms
Grants and funding
LinkOut - more resources
Full Text Sources
Medical
