. 2009 Nov;27(9):1258-70.
doi: 10.1016/j.mri.2009.05.007. Epub 2009 Jun 13.

A nonrigid registration algorithm for longitudinal breast MR images and the analysis of breast tumor response

Affiliations

A nonrigid registration algorithm for longitudinal breast MR images and the analysis of breast tumor response

Xia Li et al. Magn Reson Imaging. 2009 Nov.

Abstract

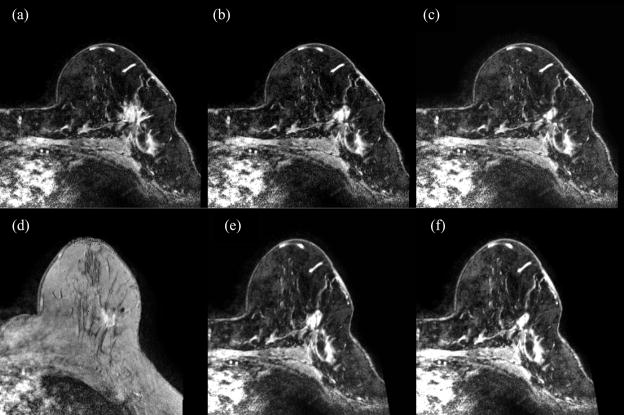
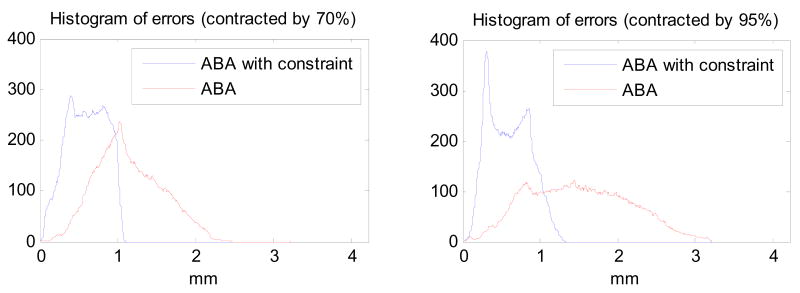
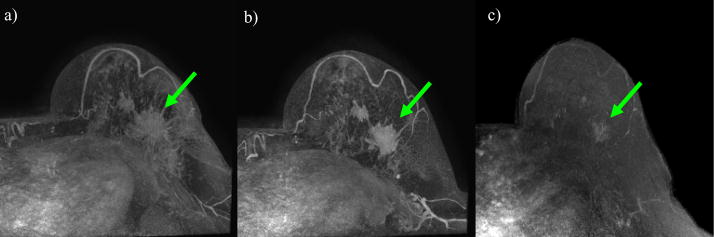
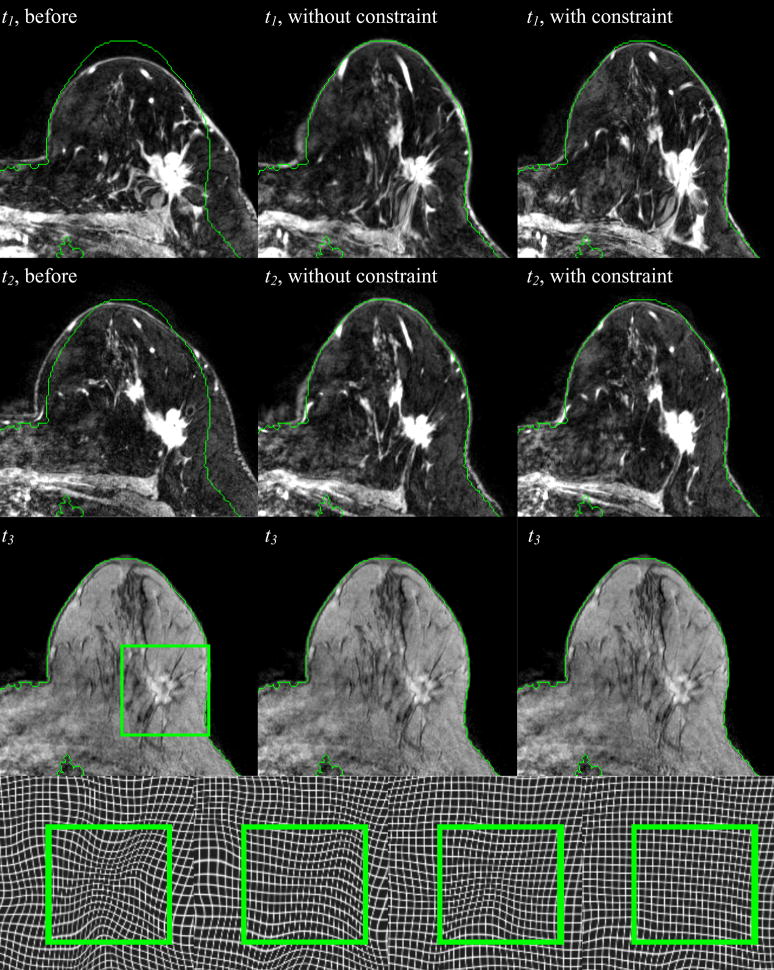
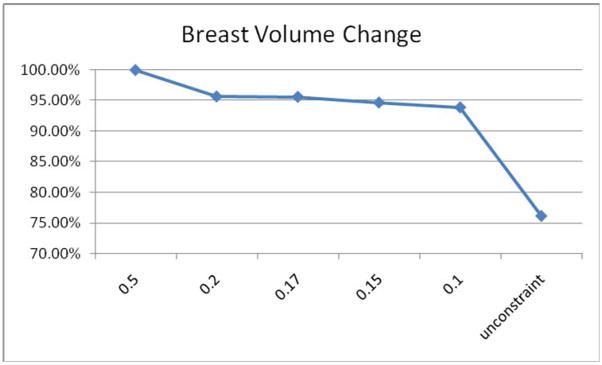
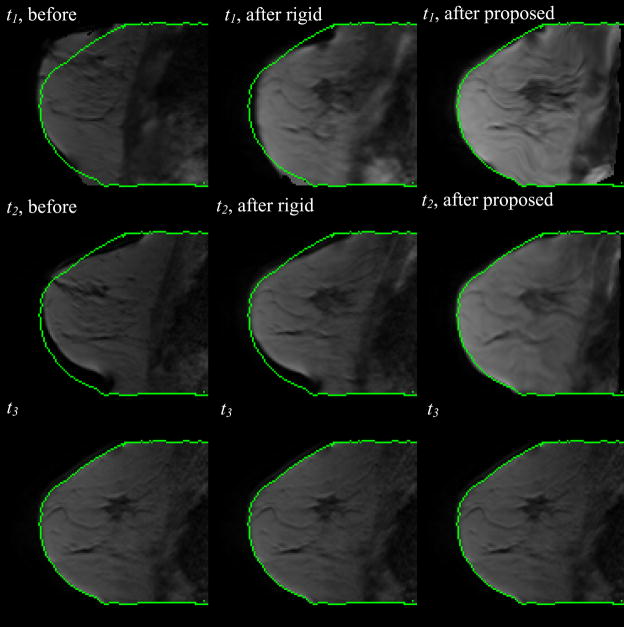
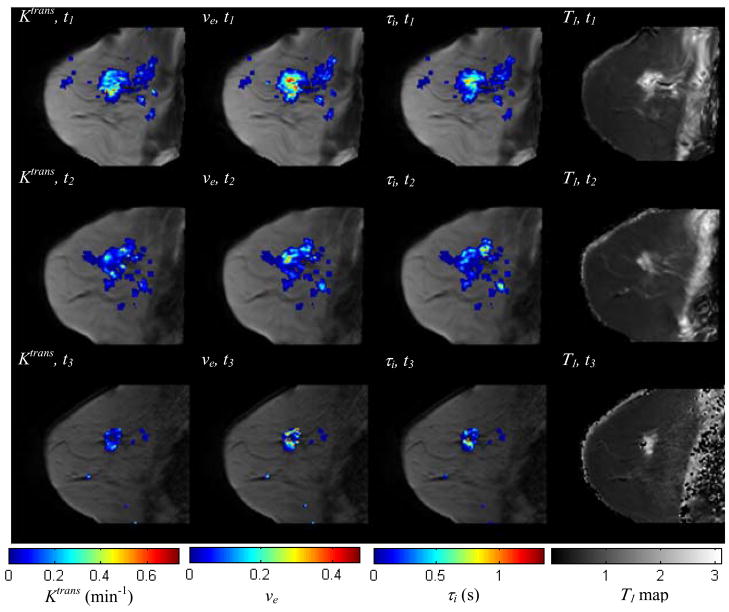
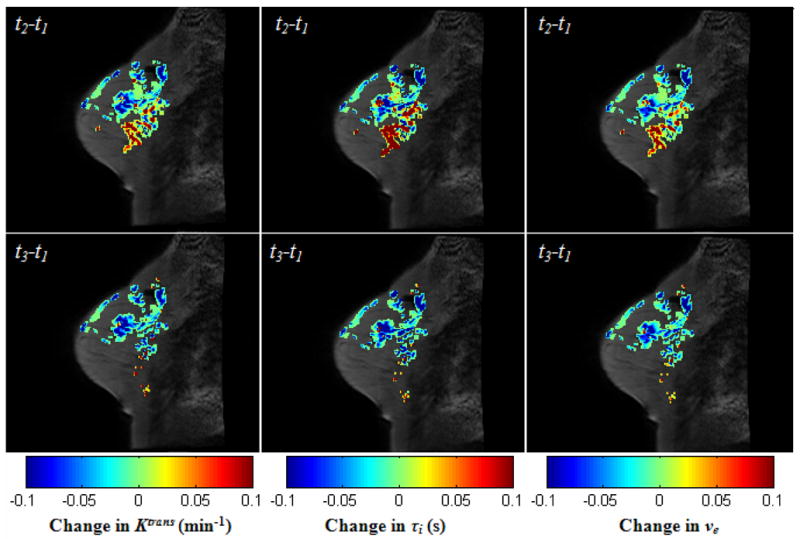
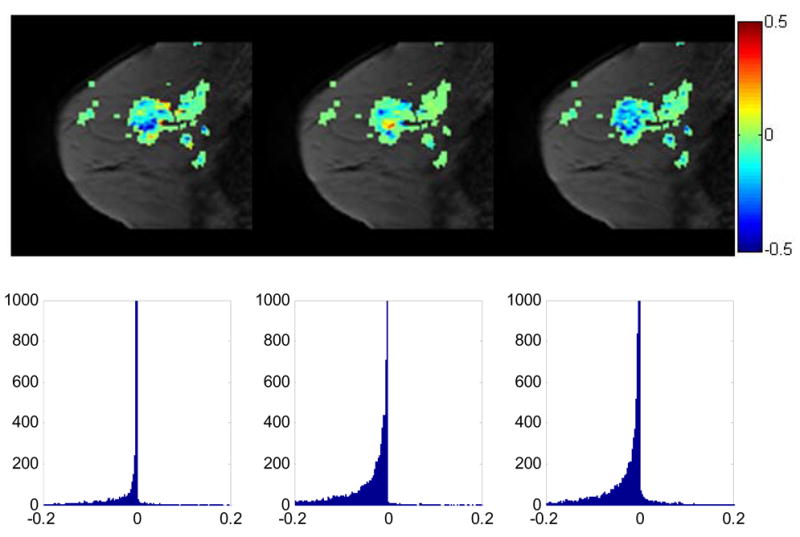
Dynamic contrast-enhanced magnetic resonance imaging (DCE-MRI) can estimate parameters relating to blood flow and tissue volume fractions and therefore may be used to characterize the response of breast tumors to treatment. To assess treatment response, values of these DCE-MRI parameters are observed at different time points during the course of treatment. We propose a method whereby DCE-MRI data sets obtained in separate imaging sessions can be co-registered to a common image space, thereby retaining spatial information so that serial DCE-MRI parameter maps can be compared on a voxel-by-voxel basis. In performing inter-session breast registration, one must account for patient repositioning and breast deformation, as well as changes in tumor shape and volume relative to other imaging sessions. One challenge is to optimally register the normal tissues while simultaneously preventing tumor distortion. We accomplish this by extending the adaptive bases algorithm through adding a tumor-volume preserving constraint in the cost function. We also propose a novel method to generate the simulated breast magnetic resonance (MR) images, which can be used to evaluate the proposed registration algorithm quantitatively. The proposed nonrigid registration algorithm is applied to both simulated and real longitudinal 3D high resolution MR images and the obtained transformations are then applied to lower resolution physiological parameter maps obtained via DCE-MRI. The registration results demonstrate the proposed algorithm can successfully register breast MR images acquired at different time points and allow for analysis of the registered parameter maps.


Figures

Figure 1
Figure 1
The original breast MR images (a), the corresponding simulated images (b and c) with tumors shrunk by ~70% and 95%, respectively. Note that the simulated images are realistic. The images with contracted tumor (b and c) are registered to the real post-treatment image (d) using the robust point matching algorithm. The generated images (e and f) are considered as the simulated post-treatment images, which are used to evaluate the proposed registration algorithm, under different contracted percentages
Figure 2
Figure 2
The histograms of errors are calculated through comparing the proposed method and ABA with the known deformations, for the tumors contracted by 70% and 95%, respectively. Note that for both cases, the proposed method leads to a more accurate registration, as well as a smaller mean error and smaller standard deviation, compared with the unconstrained ABA algorithm.
Figure 3
Figure 3
Maximum Intensity Projection (MIP) figures from breast MR volumes with tumors acquired at three different time points: a) pre-treatment, b) post-one cycle of neoadjuvant chemotherapy, c) after completion of chemotherapy. The green arrows show the location of the tumor. Note that the tumor changes in shape and size during the course of treatment. After the completion of chemotherapy (panel c), the tumor has dramatically decreased in size and the shape has changed significantly.
Figure 4
Figure 4
Three axial slices at three different time points after rigid body registration (col. 1), after nonrigid registration without the constraint (col. 2), and with the constraint (col. 3). In the 4th row, the zoom-in deformation field without and with the constraint at t1 (the 1st and 2nd panels) and t2 (the 3rd and 4th panels) are shown, respectively.
Figure 5
Figure 5
Breast volume change with different constraint parameters α. In this study, 0.15 is selected as the optimal value of α.
Figure 6
Figure 6
After the registration is determined on the high resolution THRIVE images (see Figure 4), the detected transformation is applied to the lower resolution DCE-MRI data. The central slice for three time points before (column 1) and after rigid body registration (column 2), after the proposed algorithm (column 3), are shown. The three time points (t1, t2, and t3) correspond respectively to pre-treatment, post-one cycle of neoadjuvant chemotherapy, and after completion of chemotherapy.
Figure 7
Figure 7
The central slice of low resolution breast MR image volume at three time points after the proposed registration algorithm, with Ktrans, ve, τi, color-coded and superimposed (columns 1–3). The T1 maps at different time points are shown in column 4, without any overlay. Both the area and magnitude of nonzero parameter values are decreasing, indicating the spatial (physiological) changes that occur during the course of chemotherapy. Co-registration allows for the voxel-by-voxel analysis of these changes.
Figure 8
Figure 8
The central slice with two kinds of difference images of the three parameters, Ktrans, τi, and ve, superimposed: the difference between the post-one cycle of chemotherapy and the pre-treatment (t2t1), and the difference between the completion of treatment and pre-treatment (t3t1). Note that all of three parameters are decreasing in most voxels, although there’s an increase in some other voxels after the first cycle of treatment. After the completion of chemotherapy, nearly all values of three parameters decrease.
Figure 9
Figure 9
The central slice with the change of Ktrans values (the slopes) from t1 to t2, from t2 to t3, and from t1 to t3 superimposed, respectively (1st row); the zoomed histogram (2nd row) showing the distribution of Ktrans changes in the whole tumor volume for t12, t23, and t13. For the slopes of t12, 89% slopes have negative values, while for t13 97% slopes. For t23, although only 28% of the slopes presented negative values, it is much higher than those with positive values, which is 4%. It is anticipated that a large fraction of negative slopes will be predictive of positive response to treatment; we are currently testing this hypothesis in a larger sample set.

References

    1. New Report Looks at the Latest on Breast Cancer [Internet] American Cancer Society. 2007. Available from: http://www.cancer.org/docroot/NWS/content/NWS_1_1x_Breast_Cancer_Report_....
    1. Yeh E, Slanetz P, Kopans DB, Rafferty E, Georgian-Smith D, Moy L, Halpern E, Moore R, Kuter I, Taghian A. Prospective Comparison of Mammography, Sonography, and MRI in Patients Undergoing Neoadjuvant Chemotherapy for Palpable Breast Cancer. Am J Roentgenol. 2005:867–877. - PubMed
    1. Buchholz TA, Davis DW, McConkey DJ, et al. Chemotherapy-induced apoptosis and Bcl-2 levels correlate with breast cancer response to chemotherapy. Cancer J. 2003;9:33–41. - PubMed
    1. Mohsin SK, Weiss HL, Gutierrez MC, et al. Neoadjuvant Trastuzumab Induces Apoptosis in Primary Breast Cancers. J Clin Oncol. 2005;23:2460–2468. - PubMed
    1. Stearns V, Singh B, Tsangaris T, et al. A Prospective Randomized Pilot Study to Evaluate Predictors of Response in Serial Core Biopsies to Single Agent Neoadjuvant Doxorubicin or Paclitaxel for Patients with Locally Advanced Breast Cancer. Clin Cancer Res. 2003;9:124–133. - PubMed

Publication types