Review
. 2009 Jun 15;587(Pt 12):2753-67.
doi: 10.1113/jphysiol.2009.170704.

Receptive fields and functional architecture in the retina

Affiliations
Review

Receptive fields and functional architecture in the retina

Vijay Balasubramanian et al. J Physiol. .

Abstract

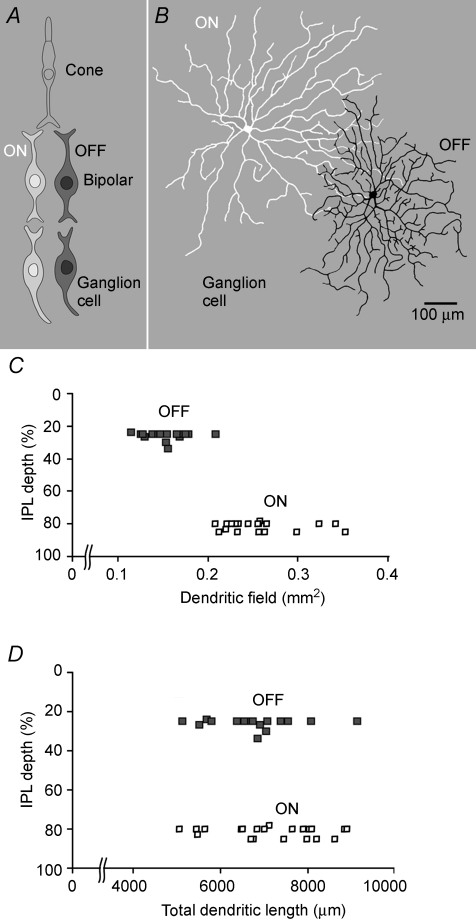
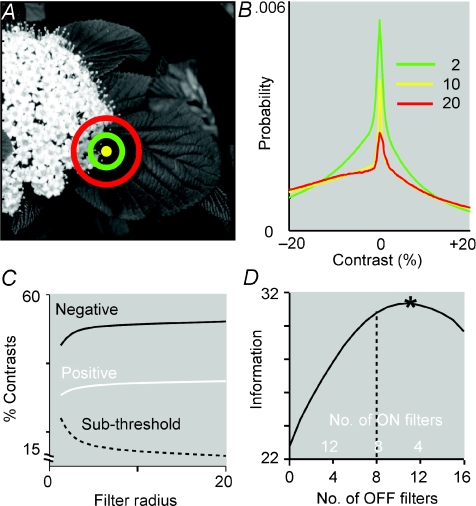
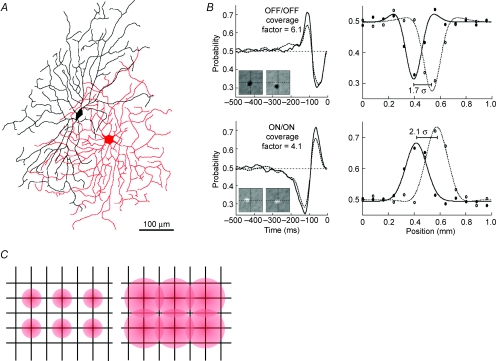
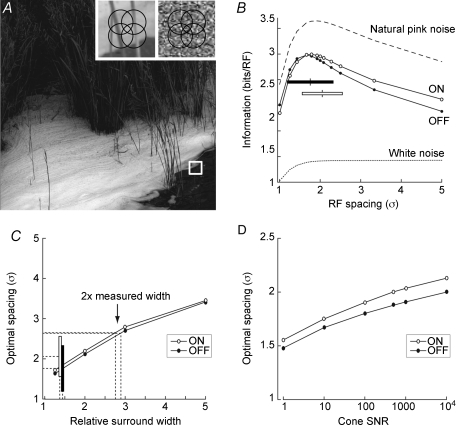
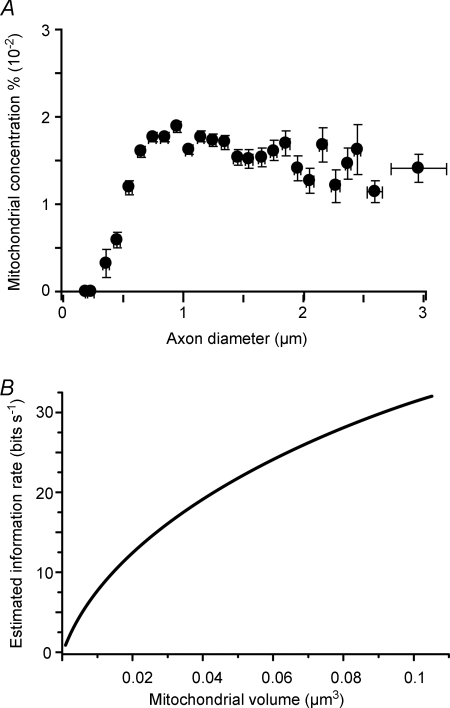
Functional architecture of the striate cortex is known mostly at the tissue level--how neurons of different function distribute across its depth and surface on a scale of millimetres. But explanations for its design--why it is just so--need to be addressed at the synaptic level, a much finer scale where the basic description is still lacking. Functional architecture of the retina is known from the scale of millimetres down to nanometres, so we have sought explanations for various aspects of its design. Here we review several aspects of the retina's functional architecture and find that all seem governed by a single principle: represent the most information for the least cost in space and energy. Specifically: (i) why are OFF ganglion cells more numerous than ON cells? Because natural scenes contain more negative than positive contrasts, and the retina matches its neural resources to represent them equally well; (ii) why do ganglion cells of a given type overlap their dendrites to achieve 3-fold coverage? Because this maximizes total information represented by the array--balancing signal-to-noise improvement against increased redundancy; (iii) why do ganglion cells form multiple arrays? Because this allows most information to be sent at lower rates, decreasing the space and energy costs for sending a given amount of information. This broad principle, operating at higher levels, probably contributes to the brain's immense computational efficiency.


Figures

Figure 1
Figure 1. Dendritic arbors of OFF ganglion cells are smaller but more densely branched
A, retina in radial view. The first synapse routes the photosignal to two classes of bipolar neuron, one excited by negative contrasts (OFF cells) and another class excited by positive contrasts (ON cells). These signals are rectified by voltage-sensitive calcium channels at the bipolar cell synapses to OFF and ON ganglion cells. The ON arbor is broad and sparsely branched whereas the OFF arbor is narrower and more densely branched. B, ON and OFF ganglion cells (brisk-transient class) in flat view. Cells were injected with fluorescent dye and photographed in the confocal microscope. The ON arbor is broad and sparsely branched whereas the OFF arbor is narrower and more densely branched. C and D, dendritic field area is smaller for OFF than for ON cells, but total dendritic lengths are the same and collect similar numbers of bipolar synapses (Xu et al. 2008) (adapted from C. Ratliff, Y.-H. Kao, P. Sterling & V. Balasubramanian, unpublished observations). IPL, inner plexiform layer.
Figure 2
Figure 2. Natural images contain more negative than positive contrasts at all scales. Correspondingly the optimal mosaic contains more OFF cells
A, centres of difference-of-Gaussians filters superimposed on an image. B, contrast distributions at three scales: the distributions are skewed, and negative contrasts are more abundant. C, proportion of negative, positive and subthreshold (<3%) contrasts. At all scales negative contrasts are ∼50% more numerous. The proportion of subthreshold contrasts declines with scale because distributions in B flatten with increasing centre radius. D, in the optimal mosaic OFF filters are more numerous and smaller than the ON filters. Here 16 filters cover 25 image pixels, and information in bits is maximized when 12 of the filters are of the OFF type (adapted from C. Ratliff, Y.-H. Kao, P. Sterling & V. Balasubramanian, unpublished observations).
Figure 3
Figure 3. Neighbouring ganglion cells overlap their dendritic fields and receptive field centres
A, dendritic fields of an OFF/OFF pair typically overlap by about 40%. B, OFF/OFF and ON/ON neighbours share similar temporal and spatial filters. Left: temporal filters superimpose (spike-triggered average of responses to white noise). Right: spatial response profiles, fitted with difference-of-Gaussians functions, show that neighbouring ganglion cell receptive fields overlap substantially. Here receptive field centres are spaced at 2.1 σ of the centre Gaussian for (ON/ON) and 1.7 σ for (OFF/OFF), corresponding, respectively, to receptive field coverage factors of 4.1 and 6.1. C, spatial resolution of the array is set by cell density. Narrow receptive fields have low overlap and low mutual redundancy, but also receive fewer synapses and thus have low signal-to-noise ratio (SNR). Wide receptive fields have high overlap and high mutual redundancy, but also receive more synapses and thus have high SNR (adapted from Borghuis et al. 2008).
Figure 4
Figure 4. Information about natural scenes is maximized when receptive fields are spaced at about twice the standard deviation of the centre Gaussian
A, information was measured for a receptive field array stimulated with natural images. Left inset: array superimposed on small patch of natural image. Right inset: array superimposed on small patch of white noise. B, information from natural images peaks at a receptive field (RF) spacing of ∼2 σ. Bars show the range of measured receptive field separations for ON (open) and OFF (filled). Tested with synthetic ‘natural’ images (see main text), information peaks at the same receptive field spacing as for natural scenes. Information represented from white noise images increases monotonically, but gradually, with centre spacing in units of σ. Hence the optimal array for white noise has large spacing and minimal receptive field overlap. C, optimal spacing is robust to differences in width of receptive field surround: a 2-fold expansion leaves optimal spacing within the measured range (ON: open bar; OFF: filled bar). Surround widths much larger (≫ 2-fold) than the measured width lead to widely spaced optimal arrays (>3 s) with bumpy contrast sensitivity surfaces. D, optimal spacing is robust to changes in estimated cone SNR: over four orders of SNR optimal array spacing remains within the measured range (adapted from Borghuis et al. 2008).
Figure 5
Figure 5. Firing patterns to different types of natural motion are similar within a cell type but different across types
Here five cells were recorded simultaneously on a multi-electrode array. Each cell responded similarly to all three motion stimuli. The brisk-transient and ON–OFF direction-selective (DS) cells responded with high peak rates and low firing fractions whereas the brisk-sustained, ON DS, and local-edge cells responded with lower peak rates and higher firing fractions. The brisk-transient and ON–OFF DS responses showed the lowest spike-time jitter across trials whereas the brisk-sustained and local-edge responses showed the highest. For sluggish types, mean firing rates were about half that of the brisk cell types (adapted from Koch et al. 2006).
Figure 6
Figure 6. All cell types transmit information with similar efficiency
Information rate (total entropy – noise entropy) was estimated by the direct method (Koch et al. 2006). A, continuous line shows the coding capacity (C(R)) of a ganglion cell at a given firing rate. This is the information rate assuming a Poisson process with each interval independent). Coloured dots show information rates for each recorded cell, and for all types of stimuli. Dashed line shows the best fit to information rate as a fraction of coding capacity: I(R) = 0.26 C(R). Information rate for all cell types and stimuli was thus ∼26% of coding capacity. B, dashed line indicates the information per spike 0.26 * C(R)/R. Lower rates carry more bits per spike. B-T, brisk-transient; B-S, brisk-sustained.; LE, local-edge. (Adapted from Koch et al. 2006.)
Figure 7
Figure 7. How information traffic is parcelled among cell types
Most information is sent over the optic nerve, not by the most familiar ‘brisk’ cells (X and Y) but rather by a diverse population of ‘sluggish’ cells.
Figure 8
Figure 8. Retinal ganglion cell axons are mostly thin
A, myelinated axons in the optic nerve range in diameter by ∼10-fold and are separated from each other by astrocyte processes (electron micrograph). Boxed region is enlarged in B. B, higher magnification shows mitochondria (mit) in axons and astrocyte processes (a). C, distribution of diameters is skewed with thin axons predominating. Shaded area includes 95% of the total and corresponds to the range (0.5–1.5 μm) where probability values were >10% of the peak. Continuous line is a lognormal fit. D, distribution of firing rates compared to distribution of axon diameters by assuming a linear relation between rate and diameter. The match seems close, especially considering that the sample sizes differ by two orders of magnitude (adapted from J. Perge, K. Koch, R. Miller, P. Sterling & V. Balasubramanian, 2009).
Figure 9
Figure 9. Metabolic cost of information: a law of diminishing returns
A, mitochondria in myelinated axons thicker than ∼0.7 μm occupy about 1.5% of the cytoplasm – independently of axon diameter. Profiles thinner than 0.7 μm have lower mitochondrial concentrations. Horizontal error bars indicate s.d. for axon diameter; vertical bars indicate s.e.m. B, information rises more slowly than energy capacity, giving a law of diminishing returns. Information rate was calculated from firing rates associated with different axon calibers (Figs 8D and 6A) (adapted from J. Perge, K. Koch, R. Miller, P. Sterling & V. Balasubramanian, 2009).

References

    1. Ahmad KM, Klug K, Herr S, Sterling P, Schein S. Cell density ratios in a foveal patch in macaque ratina. Vis Neurosci. 2003;20:189–209. - PubMed
    1. Atick JJ, Redlich AN. What does the retina know about natural scenes? Neural Comput. 1992;4:196–210.
    1. Attwell D, Laughlin S. An energy budget for signaling in the grey matter of the brain. J Cereb Blood Flow Metab. 2001;21:1133–1145. - PubMed
    1. Balasubramanian V, Berry MJ. A test of metabolically efficient coding in the retina. Network. 2002;13:531–552. - PubMed
    1. Balasubramanian V, Kimber D, Berry MJ. Metabolically efficient information processing. Neural Comput. 2001;13:799–815. - PubMed

Publication types

LinkOut - more resources