. 2009 Jul;12(7):927-31.
doi: 10.1038/nn.2336. Epub 2009 Jun 14.

Adult birdsong is actively maintained by error correction

Affiliations

Adult birdsong is actively maintained by error correction

Samuel J Sober et al. Nat Neurosci. 2009 Jul.

Abstract

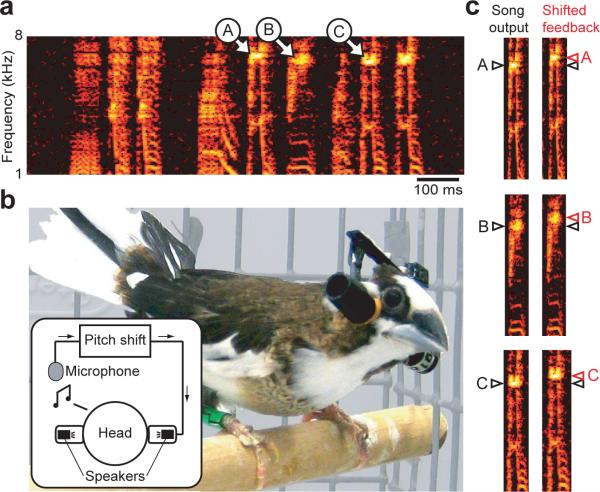
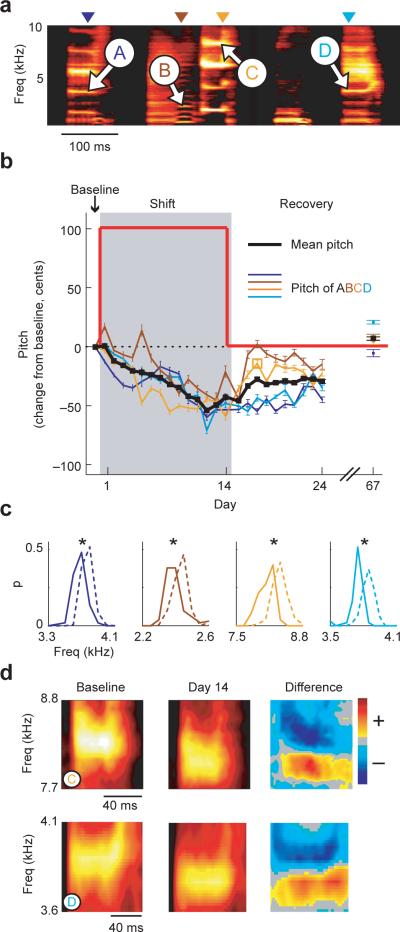
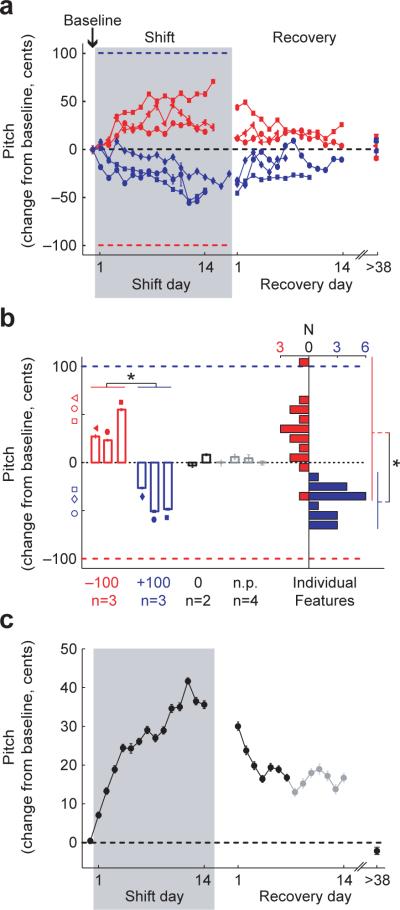
Humans learn to speak by a process of vocal imitation that requires the availability of auditory feedback. Similarly, young birds rely on auditory feedback when learning to imitate the songs of adult birds, providing one of the few examples of nonhuman vocal learning. However, although humans continue to use auditory feedback to correct vocal errors in adulthood, the mechanisms underlying the stability of adult birdsong are unknown. We found that, similar to human speech, adult birdsong is maintained by error correction. We perturbed the pitch (fundamental frequency) of auditory feedback in adult Bengalese finches using custom-designed headphones. Birds compensated for the imposed auditory error by adjusting the pitch of song. When the perturbation was removed, pitch returned to baseline. Our results indicate that adult birds correct vocal errors by comparing auditory feedback to a sensory target and suggest that lifelong error correction is a general principle of learned vocal behavior.


Figures

Figure 1
Figure 1. Technique for manipulating auditory feedback
a, Crystallized song from an adult Bengalese finch. Spectrographic representation shows the power at each frequency (color scale) as a function of time. Three harmonic features are labeled A, B, and C. b, Each bird was fit with a set of headphones that housed a pair of speakers. A microphone in the cage (see inset) provided input to online sound-processing hardware, which was used to manipulate the pitch of song. Processed acoustic signals were then relayed to the headphone speakers via a flexible cable (not shown in photograph) and played through the speakers. c, An upward (+100 cent) shift in the pitch of auditory feedback introduced by the headphone system. For each of the harmonic features labeled in (a), the left spectrogram shows the bird's acoustic output and the black triangle shows the frequency of the harmonic feature. The right spectrogram shows the pitch-shifted auditory feedback played through the headphones and the red triangle shows the frequency of the harmonic feature in the shifted song. Black triangles are repeated next to the spectrograms on the right for comparison.
Figure 2
Figure 2. Vocal error correction driven by an upward shift in the pitch of auditory feedback
a, Baseline song of Bird 1 (mean spectrogram). Arrowheads above the spectrogram indicate the spectral frames (measurement times within each syllable) at which four harmonic features (white arrows labeled A-D) were measured in order to quantify changes in the pitch of song. b, Changes in pitch in response to a 100 cent upward shift (red line) in the pitch of auditory feedback and subsequent recovery back to baseline. Colored lines show the mean +/− s.e.m. change in pitch (measured in cents, see Methods) of each harmonic feature across time, and the black line shows the mean change in the pitch of song (mean +/− s.e.m. pitch change averaged across harmonic features). After 14 days of shift exposure (gray box), unshifted auditory feedback was restored and the bird was monitored for an additional 10 days. Pitch was also measured on day 67 in order to assess any long-term changes. c, Pre- and post-shift distributions of the frequencies of the harmonic features shown in (a). For each feature, the probability distribution of frequencies during baseline (dashed lines) and day 14 (solid lines) differed significantly (asterisks indicate p<10−5, 1-tailed t-test). Color conventions for each feature as in (b). d, Pitch shift-induced changes in mean spectral structure. Left, mean spectrograms for harmonic features C (top) and D (bottom) during the baseline epoch. Middle, mean spectrograms for features C and D on shift day 14. Right, difference spectrograms obtained by subtracting the baseline spectrograms from the day 14 spectrograms.
Figure 3
Figure 3. Error correction in response to upward and downward shifts in feedback pitch
a, Mean +/− s.e.m. changes in the pitch of song (across harmonic features) as a function of time for 3 experiments with downward shifts in feedback pitch (−100 cents, red) and 3 experiments with upward shifts (+100 cents, blue). “Recovery day 1” is the first day after unshifted feedback was restored. Symbol shapes identify individual birds. Other conventions as in Figure 2b. b, Mean +/− s.e.m. change in song pitch during shift days 12−14 for downward (empty red bars) and upward (empty blue bars) shifts of auditory feedback. Symbols identify individual birds as in (a). Empty red and blue symbols at left indicate the magnitude of one s.d. of pitch variation in the baseline epoch of each experiment (averaged across harmonic features). Black bars show changes in song pitch across the same interval in birds that wore headphones but did not experience pitch shifts (“0 shift”), and gray bars show the same measure in a group of birds that did not wear headphones at all (“no phones,” or “n.p.”). Longitudinal data from the two 0 shift birds is available as Supplementary Figure 6 online. Filled bars at right show the distribution of pitch changes for individual harmonic features, combined across all downward (red) and upward (blue) shifts of auditory feedback. Asterisks indicate significant differences between the effects of upward and downward shifts (p<0.05, 1-tailed t-tests). Additionally, the changes in song pitch in each +/−100 cent shift group were significantly different from changes in both of the control groups (p<0.05 in all cases, 1-tailed t-tests). c, Combined data from all experiments, reoriented so that changes in the adaptive directions are positive. Days from which data were available from all 6 experiments are plotted in black, recovery days from which data are available from a subset of 4 experiments are plotted in gray.

References

    1. Konishi M. The role of auditory feedback in the control of vocalization in the white-crowned sparrow. Zeitschrift fur Tierpsychologie. 1965;22:770–783. - PubMed
    1. Kuhl PK. Learning and representation in speech and language. Curr. Opin. in Neurobiol. 1995;4:812–822. - PubMed
    1. Arnold AP. The effects of castration on song development in zebra finches (Poephila guttata). J. Exp. Zool. 1975;191:261–278. - PubMed
    1. Olveczky BP, Andalman AS, Fee MS. Vocal experimentation in the juvenile songbird requires a basal ganglia circuit. PLoS Biol. 2005;3:e153. - PMC - PubMed
    1. Kao MH, Doupe AJ, Brainard MS. Contributions of an avian basal gangliaforebrain circuit to real-time modulation of song. Nature. 2005;433:638–43. - PubMed

Publication types