. 2009 Jul;41(7):776-82.
doi: 10.1038/ng.401. Epub 2009 Jun 14.

Meta-analysis of genome scans and replication identify CD6, IRF8 and TNFRSF1A as new multiple sclerosis susceptibility loci

Affiliations

Meta-analysis of genome scans and replication identify CD6, IRF8 and TNFRSF1A as new multiple sclerosis susceptibility loci

Philip L De Jager et al. Nat Genet. 2009 Jul.

Abstract

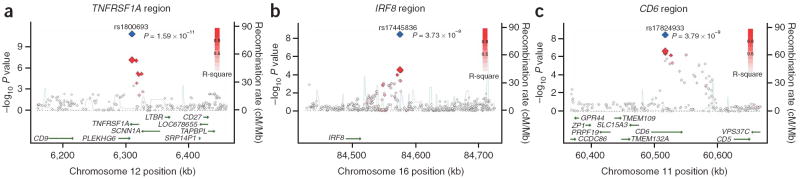
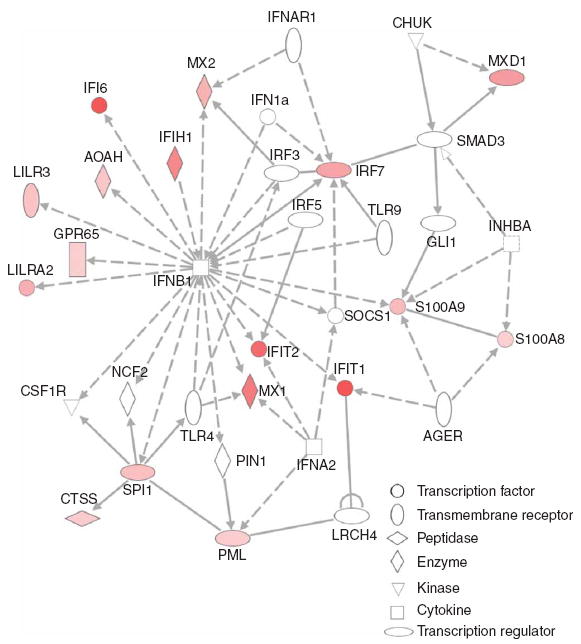
We report the results of a meta-analysis of genome-wide association scans for multiple sclerosis (MS) susceptibility that includes 2,624 subjects with MS and 7,220 control subjects. Replication in an independent set of 2,215 subjects with MS and 2,116 control subjects validates new MS susceptibility loci at TNFRSF1A (combined P = 1.59 x 10(-11)), IRF8 (P = 3.73 x 10(-9)) and CD6 (P = 3.79 x 10(-9)). TNFRSF1A harbors two independent susceptibility alleles: rs1800693 is a common variant with modest effect (odds ratio = 1.2), whereas rs4149584 is a nonsynonymous coding polymorphism of low frequency but with stronger effect (allele frequency = 0.02; odds ratio = 1.6). We also report that the susceptibility allele near IRF8, which encodes a transcription factor known to function in type I interferon signaling, is associated with higher mRNA expression of interferon-response pathway genes in subjects with MS.


Figures

Figure 1
Figure 1
Enrichment of associations in the replication stage that are consistent with the meta-analysis. Plot shows a histogram of the absolute values of the replication study Z scores from the 180 SNPs included in the replication analysis (see Supplementary Table 3 for detailed results). In this case, the direction of the association reflects consistency with the results of the meta-analysis: a positive Z score is in the same direction in both the meta-analysis and the replication analysis while a negative Z score highlights the fact that the two analyses are discordant. An excess of concordant, highly significant associations is noted. A null distribution is plotted to highlight this enrichment.
Figure 2
Figure 2
Three previously unidentified loci, TNFRSF1A, IRF8 and CD6, with genome-wide level of evidence of association to MS. (a) Illustration of the TNFRSF1A locus, with the local recombination rate plotted in light blue over this 200-kb chromosomal segment centered on rs1800693. Each diamond represents one SNP found in this locus, and the most associated SNP in the meta-analysis, rs1800693, is marked by a red diamond. A blue diamond is used to represent the level of evidence associated with rs1800693 in the joint analysis that includes the replication data. The color of each circle is defined by the extent of LD with rs1800693: red (r2 > 0.8), orange (0.8 > r2 > 0.5), gray (0.5 > r2 > 0.3) and white (r2 > 0.3). Physical positions are based on build 36 of the human genome. rs1800693 is located in an intron of TNFRSF1A. (b) Illustration of the IRF8 locus, with the most associated SNP in this locus, rs17445836, highlighted by red (meta-analysis result) and blue (joint analysis result) diamonds. Here, we also present all SNPs found within a 200-kb window centered on rs17445836 and define SNP colors based on LD to rs17445836. (c) Illustration of the CD6 locus, with the most associated SNP in this locus, rs17824933, highlighted by red (meta-analysis result) and blue (joint analysis result) diamonds. Here, we also present all SNPs found within a 200-kb window centered on rs17824933 and define SNP colors based on LD to rs17824933. In this case, CD6 is the only gene found in the large block of LD that contains the association to MS susceptibility. Linkage disequilibrium maps are presented for all three loci in Supplementary Figure 1a–c online.
Figure 3
Figure 3
Interferon response genes are coordinately upregulated relative to the rs17445836[G] allele of IRF8. Using the Ingenuity Pathways Analysis software suite, we illustrate the network of genes in the “interferon signaling pathway” whose expression is found to be correlated with the rs17445836[G] allele in untreated MS subjects. The diagram highlights those genes in this pathway whose expression are upregulated (red) in the presence of the rs17445836[G] allele. The magnitude of each gene’s association is reflected by the intensity of the color, with brighter red indicating a stronger correlation between rs17445836[G] and RNA expression. A white color denotes a gene found in the associated pathway but which failed to meet a nominal P < 0.05 threshold for association of its RNA expression with rs17445836[G]. The shapes of each gene symbol denote the class of that gene as defined by the Ingenuity Pathways application: horizontal oval, transcription regulator; vertical oval, transmembrane receptor; rectangle, G protein–coupled receptor; horizontal diamond, peptidase; vertical diamond, enzyme; triangle, kinase; square, cytokine; circle, other.

References

    1. Hauser SL, Oksenberg JR. The neurobiology of multiple sclerosis: genes, inflammation, and neurodegeneration. Neuron. 2006;52:61–76. - PubMed
    1. Barcellos LF, et al. Heterogeneity at the HLA-DRB1 locus and risk for multiple sclerosis. Hum Mol Genet. 2006;15:2813–2824. - PubMed
    1. Yeo TW, et al. A second major histocompatibility complex susceptibility locus for multiple sclerosis. Ann Neurol. 2007;61:228–236. - PMC - PubMed
    1. Hafler DA, et al. Risk alleles for multiple sclerosis identified by a genomewide study. N Engl J Med. 2007;357:851–862. - PubMed
    1. Rubio JP, et al. Replication of KIAA0350, IL2RA, RPL5 and CD58 as multiple sclerosis susceptibility genes in Australians. Genes Immun. 2008;9:624–630. - PubMed

Publication types

MeSH terms

Substances