. 2009 Jul;16(7):754-62.
doi: 10.1038/nsmb.1621. Epub 2009 Jun 14.

Structural basis for ESCRT-III protein autoinhibition

Affiliations

Structural basis for ESCRT-III protein autoinhibition

Monika Bajorek et al. Nat Struct Mol Biol. 2009 Jul.

Abstract

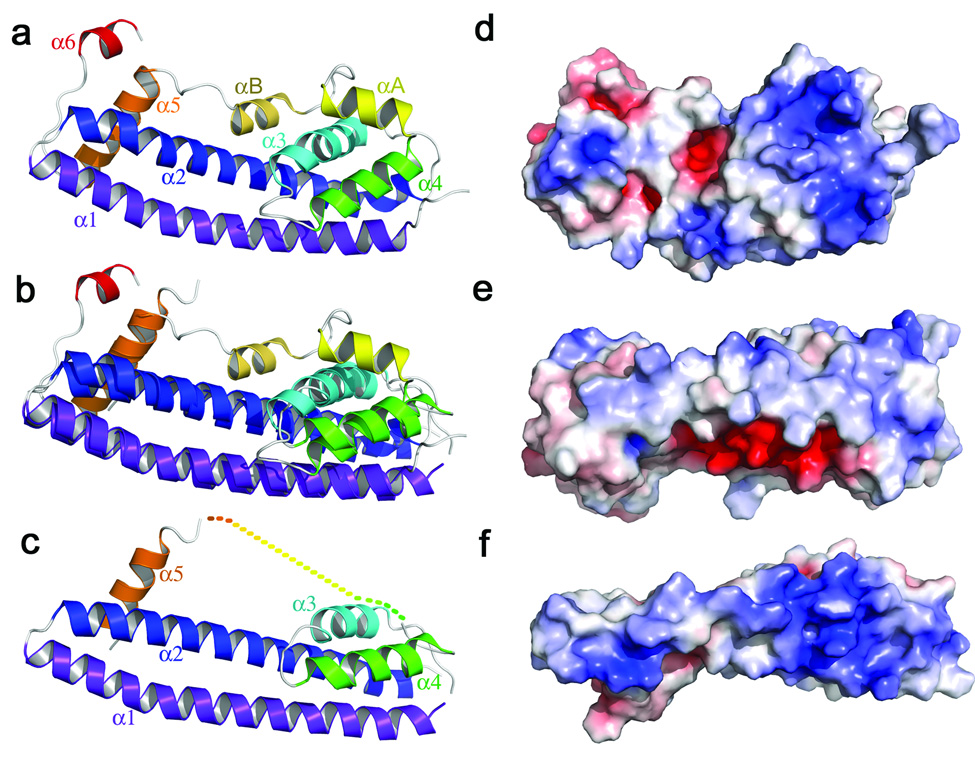
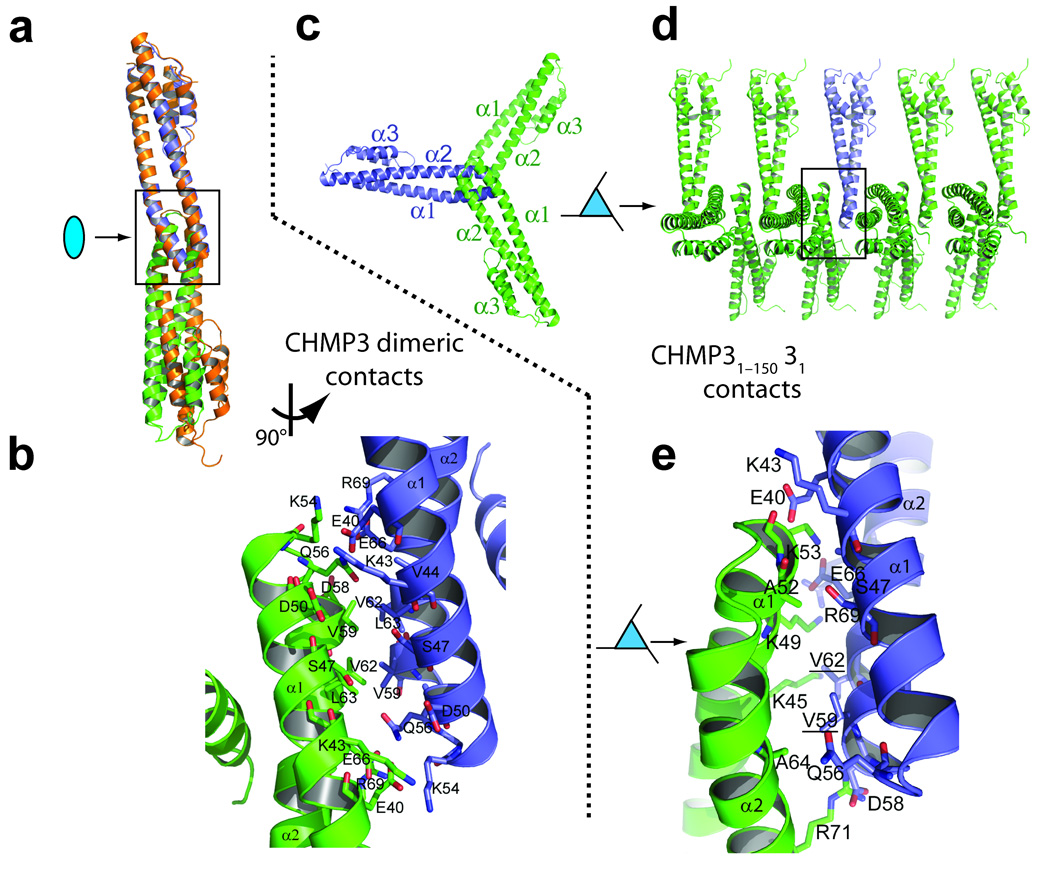
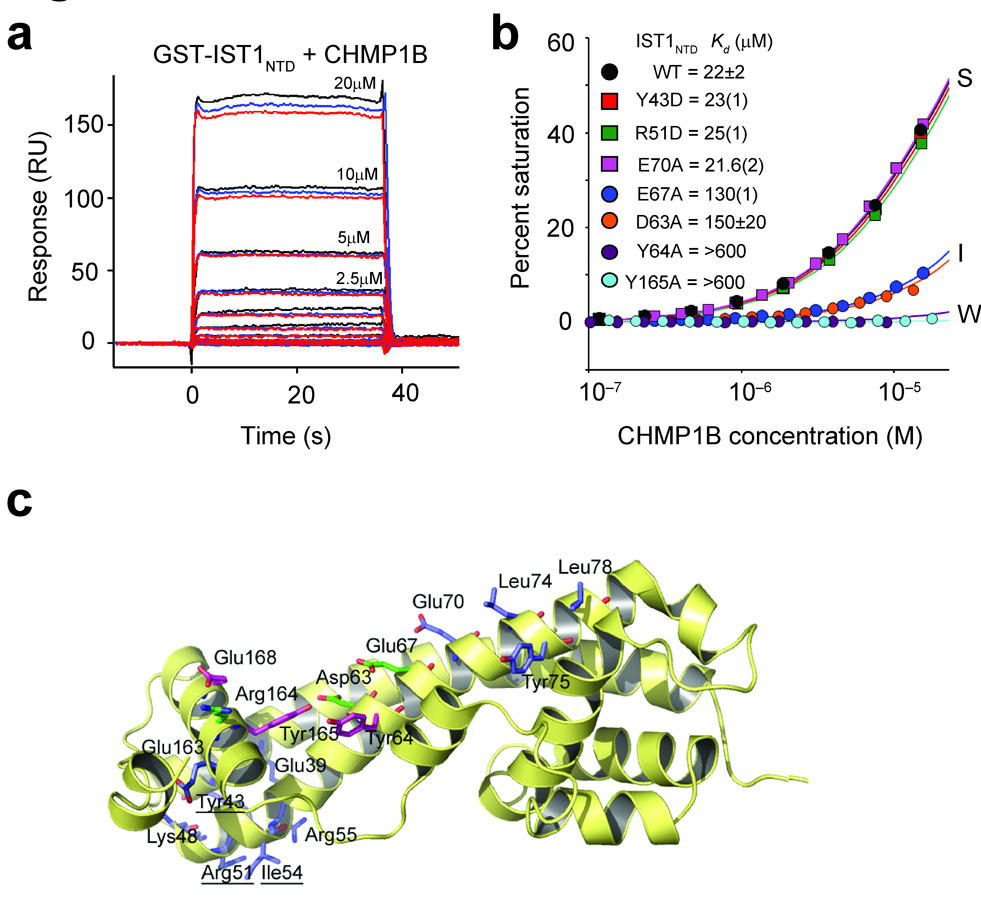
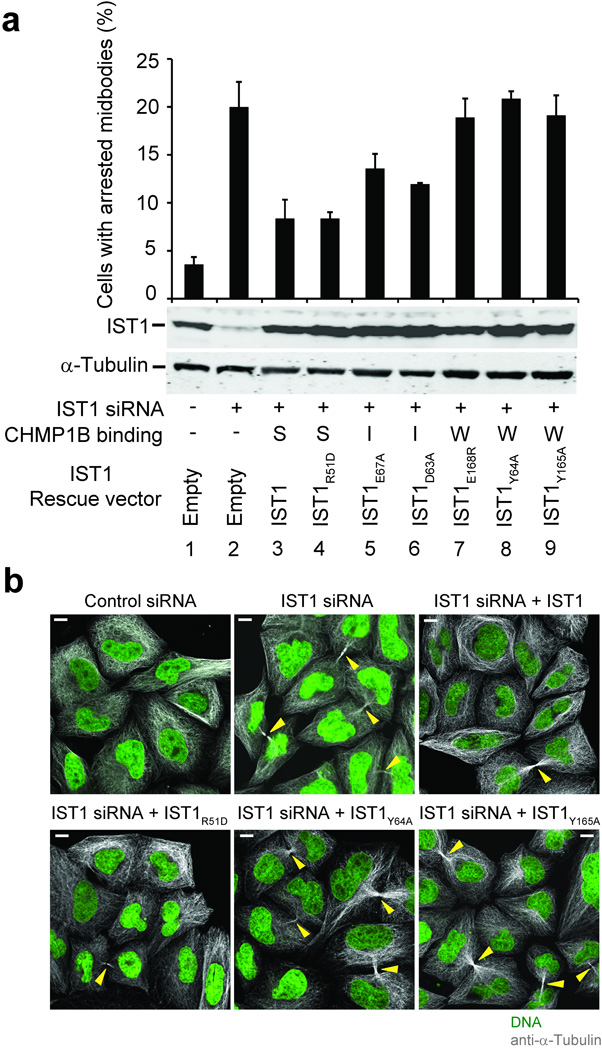
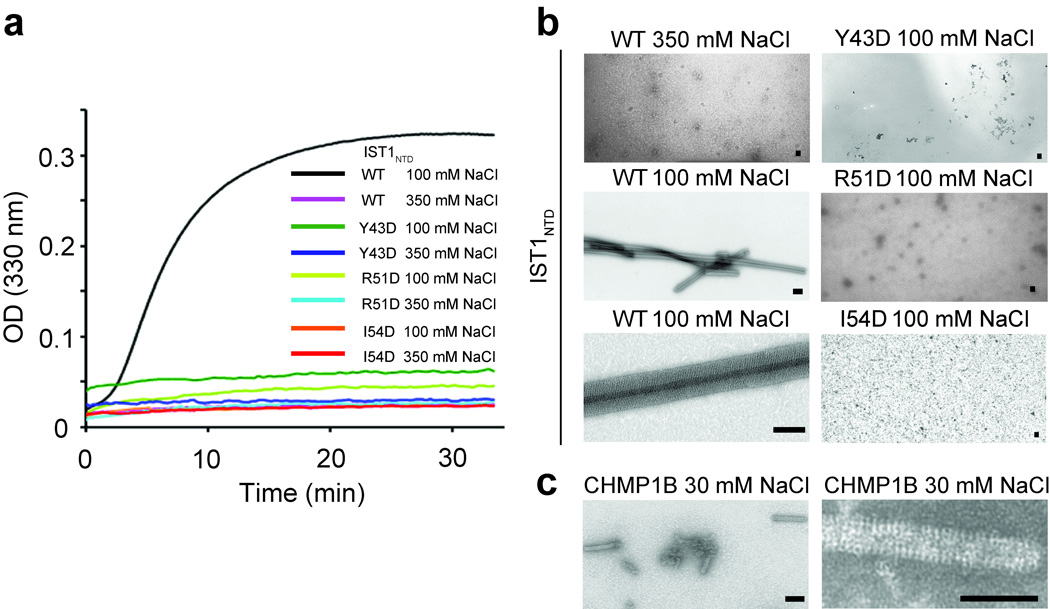
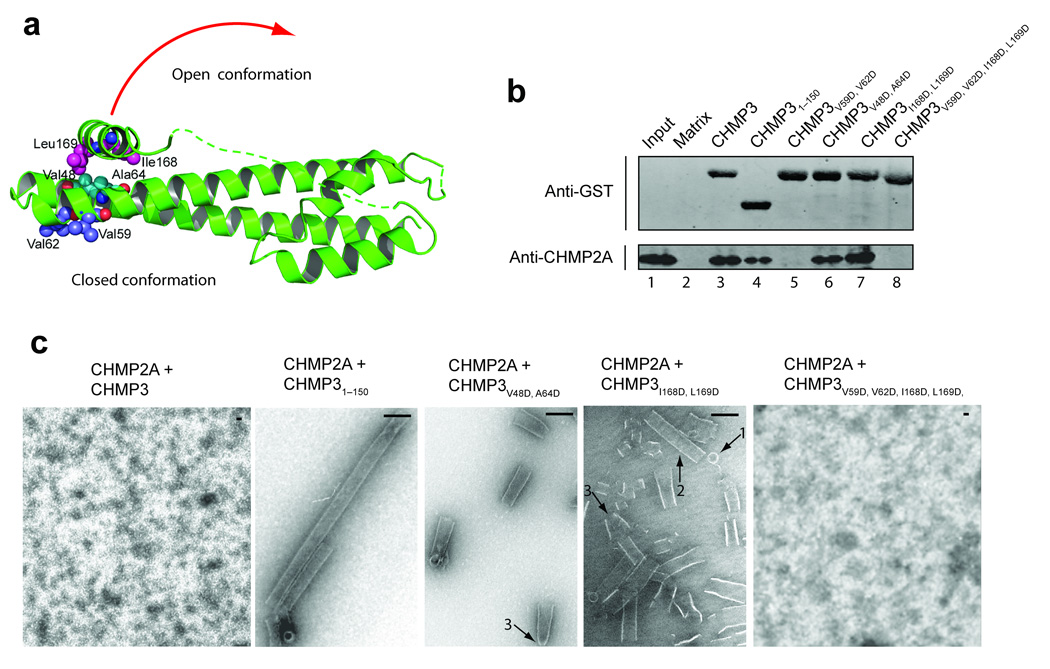
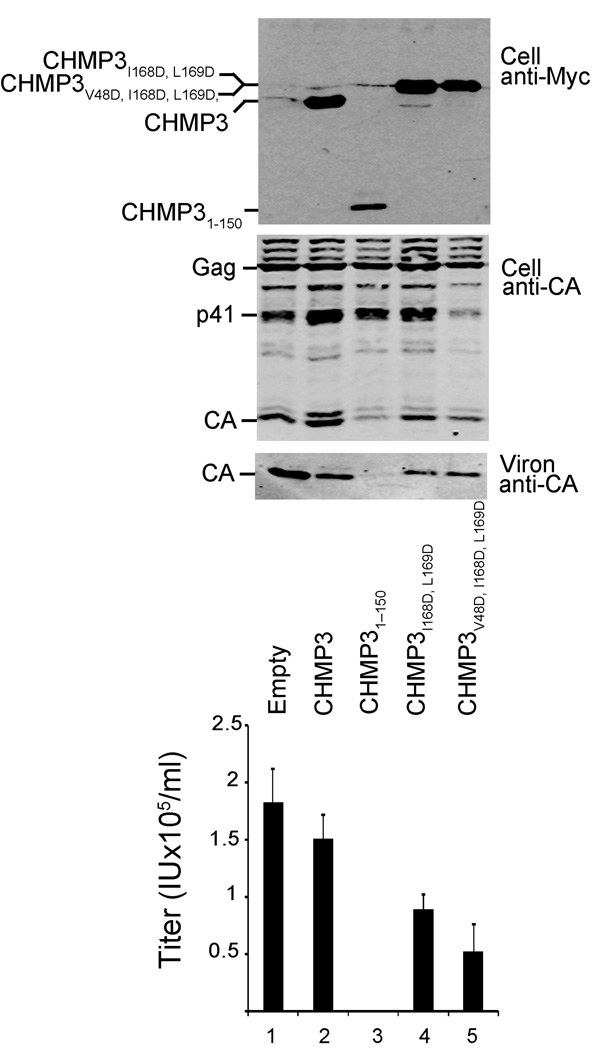
Endosomal sorting complexes required for transport-III (ESCRT-III) subunits cycle between two states: soluble monomers and higher-order assemblies that bind and remodel membranes during endosomal vesicle formation, midbody abscission and enveloped virus budding. Here we show that the N-terminal core domains of increased sodium tolerance-1 (IST1) and charged multivesicular body protein-3 (CHMP3) form equivalent four-helix bundles, revealing that IST1 is a previously unrecognized ESCRT-III family member. IST1 and its ESCRT-III binding partner, CHMP1B, both form higher-order helical structures in vitro, and IST1-CHMP1 interactions are required for abscission. The IST1 and CHMP3 structures also reveal that equivalent downstream alpha5 helices can fold back against the core domains. Mutations within the CHMP3 core-alpha5 interface stimulate the protein's in vitro assembly and HIV-inhibition activities, indicating that dissociation of the autoinhibitory alpha5 helix from the core activates ESCRT-III proteins for assembly at membranes.


Figures

Figure 1
Figure 1
CHMP3, CHMP38–222 and IST1NTD are monomers in solution. Equilibrium sedimentation distributions of recombinant CHMP3 (a), CHMP38–222 (b), and IST1NTD (c) (upper panels), and residual differences (lower panels), with data points shown in open symbols and the single species models shown as solid lines. Rotor speeds were 20,000 RPM and initial subunit protein concentrations are shown. Data sets were also collected at 24,000 RPM (not shown) and all of the data were globally fit to single species models in which the molecular weights were allowed to float during the refinement. Estimated molecular weights were: CHMP3, 25,840 Da (MWmonomer = 25,267 Da, Mobs/Mcalc = 1.02); CHMP38–222, 24,390 Da (MWmonomer = 24,663 Da, Mobs/Mcalc = 0.99); IST1NTD, 20,520 Da (MWmonomer = 21,791 Da, Mobs/Mcalc = 0.94).
Figure 2
Figure 2
Structures of IST1NTD and CHMP3. (a) Ribbon diagram and helix labeling scheme for IST1NTD. (b) Overlay of the ordered regions of IST1NTD and CHMP38–183. (c) Ribbon diagram of CHMP38–222. (d) Space filling model of IST1NTD, color coded to show the surface charge distribution (blue, basic; red, acidic; ± 7kV),. The molecule is shown in the same orientation as in a. (e) Same as d. The view is toward α1, and was generated from d by rotation about the horizontal so that the bottom edge of d faces the viewer. (f) Space filling model of CHMP38–222 shown in an equivalent orientation to the view of IST1NTD shown in e, emphasizing the basicity of the α1 surface of CHMP3.
Figure 3
Figure 3
CHMP3 crystal packing interactions. (a) Overlay of the cores of the “tip-to-tip” dimers in the crystal lattices of CHMP38–183 (orange) and CHMP38–222 (blue and green). The upper subunits were aligned, and the lower subunits diverge owing to small differences in their tip-to-tip interfaces. (b) Detailed expansion of the boxed region of CHMP38–222 shown in a. Both here and in e, most side chains conformations are shown as defined in the CHMP38–183 search model, with some minor adjustments to avoid clashes. Precise description of these side chain conformations is not possible at current resolutions. (c) Subunit packing down the 31 screw axis of the CHMP31–150 crystal lattice, with a single CHMP31–150 molecule highlighted in blue. (d) Same assembly as in c, but viewed perpendicularly to the 31 screw axis. (e) Detailed expansion of the boxed area shown in d.
Figure 4
Figure 4
Mutational analyses of IST1-CHMP1B interactions. (a) Sensorgrams showing different concentrations of purified CHMP1B binding to immobilized GST-IST1NTD. Triplicate measurements in response units (RU) are shown for each CHMP1B concentration. (b) Representative biosensor binding isotherms showing CHMP1B binding to wild type (WT) and mutant GST-IST1NTD proteins with strong (S), intermediate (I) and weak (W) binding affinities. IST1NTD mutations and estimated dissociation constants are given in the inset. Errors represent either standard deviations from multiple independent measurements (n≥3), or standard deviations derived from single isotherms measured in triplicate (values in parentheses report the standard deviations in the final digit of the measurement).(c) Ribbon diagram showing the location of all IST1NTD mutations tested for CHMP1 binding. Mutated residues are shown explicitly, and the binding affinities of the mutant proteins are color-coded as follows: blue, strong (S) binding (binding affinities within 1.5-fold of wild type IST1NTD); green, intermediate (I) binding (binding affinity reduced 1.5–8 fold); magenta, weak (W) binding (binding affinity reduced ≥8-fold).
Figure 5
Figure 5
Requirement for IST1-CHMP1 interactions during abscission. (a) The upper panel shows quantified abscission defects as reflected in the percentages of HeLa M cells with visible midbodies following siRNA treatment to deplete endogenous IST1 (lanes 2–9) and rescue with an empty vector control (lane 2, negative control) or with vectors expressing wild type IST1 (lane 3, positive control) or the designated IST1 mutants (lanes 4–9). Untreated cells are shown in lane 1. Error bars show standard deviations from three independent repetitions of the experiment. The middle panel is a western blot (anti-IST1) showing levels of soluble endogenous IST1 (lanes 1 and 2) or exogenously expressed IST1 proteins (lanes 3–9). The bottom panel is a western blot (anti-α-Tubulin) showing expression levels of endogenous α-Tubulin (loading control). CHMP1B binding phenotypes of the different IST1 proteins are shown below: strong (S), intermediate (I), or weak (W). (b) Immunofluorescence images showing the midbody phenotypes of cells from a designated subset of the experiments from a. Microtubules (anti-α-Tubulin, grey) and nuclei (SYTOX green) were stained for reference, and yellow arrowheads highlight midbodies. Scale bars are 10µm.
Figure 6
Figure 6
IST1NTD and CHMP1B tube assembly. (a) Assembly of wild type (WT) IST1NTD or three different IST1NTD mutants with the designated amino acid substitutions at the tip of the α1/α2 hairpin (mutated residues are underlined in Fig. 4c). IST1NTD proteins were diluted from concentrated protein stocks in high salt buffers to final concentrations of 62 µM. Salt concentrations in the assembly buffers are provided in the inset key and protein assembly was followed by light scattering at 330 nm. (b) Transmission electron microscopic images of a subset of the wild type and mutant IST1NTD assembly reactions from a. Note that IST1NTD only assembled under low salt conditions (compare upper and middle left panels) and that IST1NTD proteins with different point mutations at the tip of the α1/α2 hairpin did not assemble in either high salt (not shown) or low salt conditions (right panels). An expanded view of a single IST1NTD tube is shown in the lower left panel. Scale bars are 500 nm. (c) Transmission electron microscopic images of CHMP1B tubes assembled under low salt conditions. A field of tubes is shown in the left panel and an expanded view of a single CHMP1B tube is shown in the right panel. Scale bars are 500 nm.
Figure 7
Figure 7
CHMP3 activation in vitro. (a) Ribbon diagram showing the locations of mutated CHMP3 residues at the tip of the α1/α2 hairpin (purple) and activating mutations on either side of the interface between the core α2 helix (cyan) and the autoinhibitory α5 helix (magenta). The red arrow suggests how the closed CHMP3 conformation might convert into an open conformation by dissociation of the autoinhibitory α5 helix from the core. (b) GST pull-down analyses of the binary CHMP3/CHMP2A interaction. Pure recombinant CHMP2A (lower panel, anti-CHMP2A) was tested for binding to a glutathione sepharose matrix (lane 2, negative control) or to immobilized wild type (lane 3) or mutant GST-CHMP3 proteins (lanes 4–8). Both proteins were detected by Western blotting, and input CHMP2A (0.3%) is shown in lane 1 for reference. (c) EM analyses of helical CHMP3-CHMP2A assembly. Different panels show assemblies formed by 1:1 mixtures CHMP2A with: full length, wild type CHMP3 (panel 1, negative control, no assembly), CHMP31–150 core domain (panel 2, positive control), activated CHMP3V48D,A64D (panel 3), activated CHMP3I168D,L169D (panel 4), and activated and tip mutant CHMP3I168D,L169D,V59D,V62D (panel 5, no assemblies). Arrows highlight rings (1), tubes (2), and cones/tapered tubes (3). Scale bars are 100 nm.
Figure 8
Figure 8
CHMP3 activation in vivo. HIV-1 vector expression and release upon co-expression with an empty vector (negative control, lane 1), or with vectors expressing wild type CHMP3 (negative control, lane 2), a CHMP31–150 protein lacking the entire autoinhibitory region (positive control, lane 3), proteins with activating mutations in the α5-core interface: CHMP3I168D, L169D (lane 4), and CHMP3V48D, 168D, L169D (lane 5). Western blots in the first two panels show cellular expression levels of CHMP3-Myc proteins (panel 1, anti-Myc) and of the viral Gag protein and its p41 and CA processing products (panel 2, anti-CA). The western blot in panel 3 shows levels of released, virion-associated CA proteins. The bottom graph shows the infectious titers of HIV-1 vectors released under the different conditions (infectious units ml−1, error bars show standard deviations in multiple titer measurements, n≥4).

References

    1. Hurley JH. ESCRT complexes and the biogenesis of multivesicular bodies. Curr Opin Cell Biol. 2008;20:4–11. - PMC - PubMed
    1. Williams RL, Urbe S. The emerging shape of the ESCRT machinery. Nat Rev Mol Cell Biol. 2007;8:355–368. - PubMed
    1. Saksena S, Sun J, Chu T, Emr SD. ESCRTing proteins in the endocytic pathway. Trends Biochem Sci. 2007;32:561–573. - PubMed
    1. Piper RC, Katzmann DJ. Biogenesis and function of multivesicular bodies. Annu Rev Cell Dev Biol. 2007;23:519–547. - PMC - PubMed
    1. Hanson PI, Roth R, Lin Y, Heuser JE. Plasma membrane deformation by circular arrays of ESCRT-III protein filaments. J Cell Biol. 2008;180:389–402. - PMC - PubMed

Publication types

MeSH terms