. 2009 Jun 15;4(6):e5922.
doi: 10.1371/journal.pone.0005922.

The Gs-linked receptor GPR3 inhibits the proliferation of cerebellar granule cells during postnatal development

Affiliations

The Gs-linked receptor GPR3 inhibits the proliferation of cerebellar granule cells during postnatal development

Shigeru Tanaka et al. PLoS One. .

Abstract

Background: During postnatal murine and rodent cerebellar development, cerebellar granule precursors (CGP) gradually stop proliferating as they differentiate after migration to the internal granule layer (IGL). Molecular events that govern this program remain to be fully elucidated. GPR3 belongs to a family of Gs-linked receptors that activate cyclic AMP and are abundantly expressed in the adult brain.

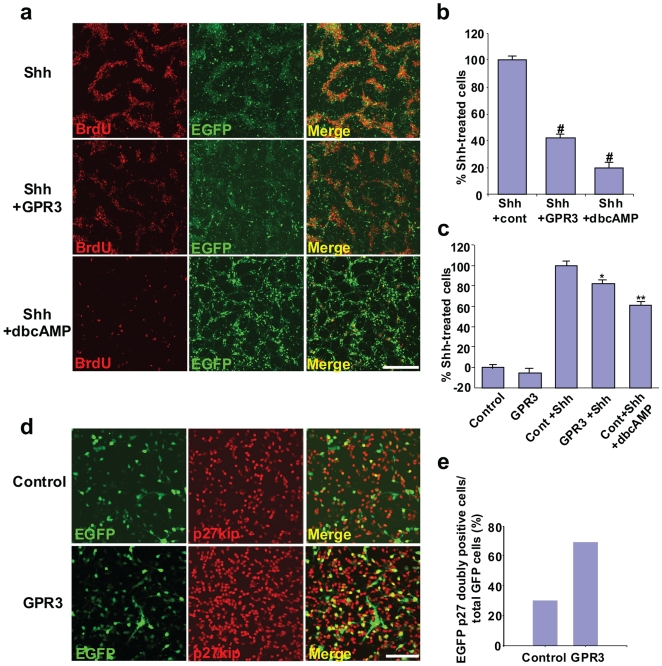
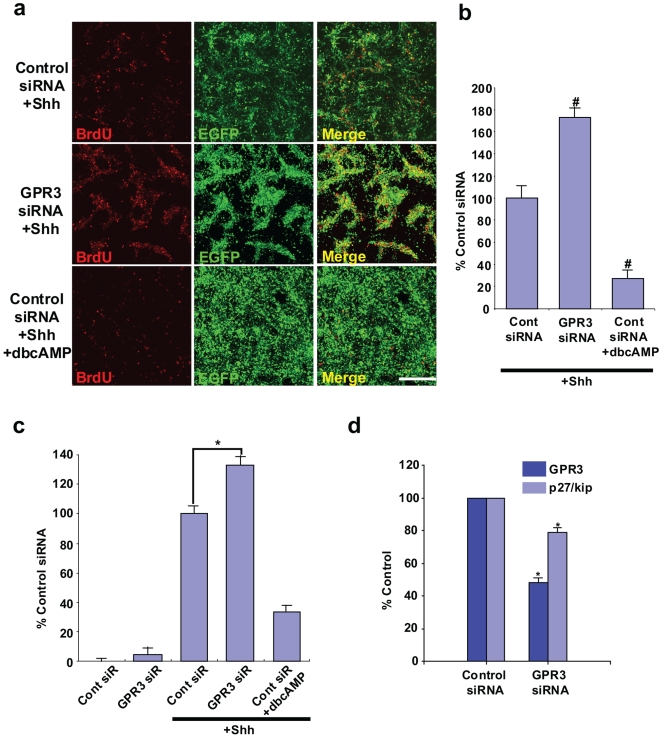
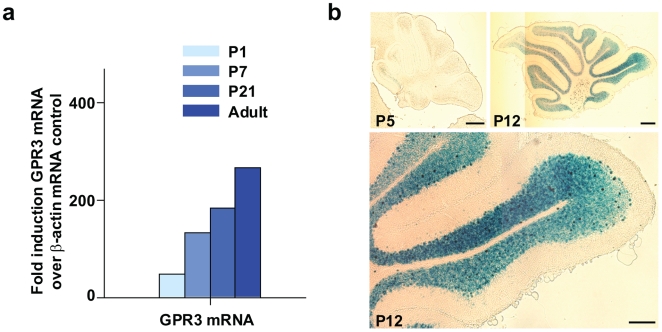
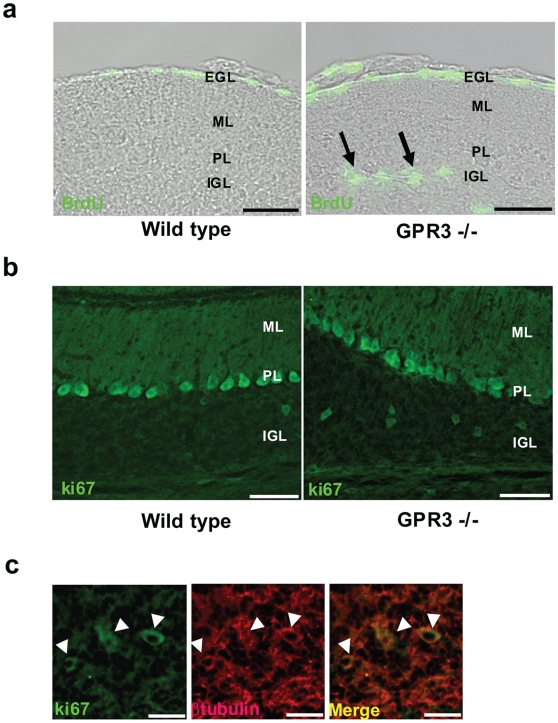
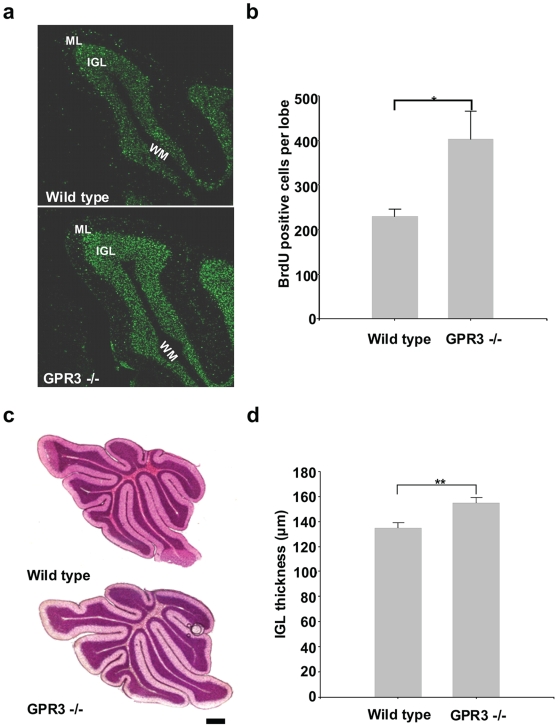
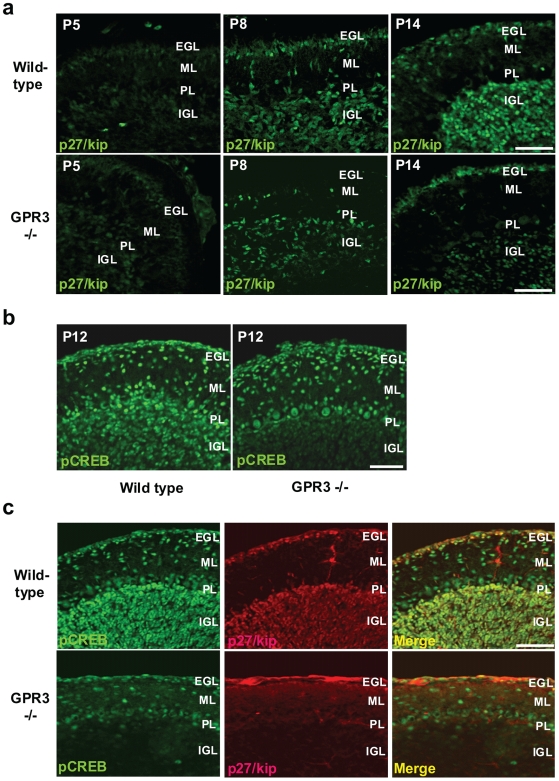
Methodology/principal findings: To investigate the role of this orphan receptor in CGP differentiation, we determined that exogenous GPR3 expression in rat cerebellar granule neurons partially antagonized the proliferative effect of Sonic hedgehog (Shh), while endogenous GPR3 inhibition by siRNA stimulated Shh-induced CGP proliferation. In addition, exogenous GPR3 expression in CGPs correlated with increased p27/kip expression, while GPR3 knock-down led to a decrease in p27/kip expression. In wild-type mice, GPR3 expression increased postnatally and its expression was concentrated in the internal granular layer (IGL). In GPR3 -/- mice, the IGL was widened with increased proliferation of CGPs, as measured by bromodeoxyuridine incorporation. Cell cycle kinetics of GPR3-transfected medulloblastoma cells revealed a G0/G1 block, consistent with cell cycle exit.

Conclusions/significance: These results thus indicate that GPR3 is a novel antiproliferative mediator of CGPs in the postnatal development of murine cerebellum.


Conflict of interest statement

Competing Interests: The authors have declared that no competing interests exist.

Figures

Figure 1
Figure 1. Exogenous GPR3 partially inhibits Shh-induced proliferation of rodent cerebellar granule neurons and is associated with increased p27/Kip expression.
GCPs isolated from rat cerebellum (P7) were electroporated with a GPR3/EGFP or control vector using the AMAXA nucleofector system. Shh (1 ug/ml) was then added 6 hours later. Thirty hours later, BrdU (final concentration = 10 µM) was added 12 hours prior to fixation. Cell proliferation was determined using BrdU incorporation assessed by immunohistochemistry with a BrdU-specific monoclonal antibody (panels a, b). dbcAMP (100 µM) was used as a chemical cAMP activator and as a positive control. In panel a, representative fields from dishes are visualized from the Shh and control vector group (top row), Shh and GPR3/EGFP-electroporated group (middle row) and the Shh, control vector group and dbcAMP (bottom row). Visualization by BrdU immunohistochemistry (red dye), EGFP fluorescence (green dye), and the combined merged image are shown. Five random fields were selected per each dish (n = 3) from the Shh, Shh+GPR3 and Shh+GPR3+cAMP groups. The number of GFP-positive cells (representing positively transfected neurons) was counted (at least one hundred GFP-positive neurons per each field). Doubly labeled cells (yellow color) were also enumerated per each dish. Values were then expressed as the percentage of doubly-labeled cells out of total GFP positive cells in the Shh+GPR3 group or Shh+GPR3+dbcAMP groups compared to Shh group, i.e. % Shh-treated cells (panel b). In parallel, cell proliferation was also determined using an ELISA assay based on the measurement of BrdU incorporation during DNA synthesis (Panel C) Variations between percentage of cells on the plates in panel b and c are likely due to differences in assays (visual counting vs. counting by colorimetry). For p27/kip1 expression (panel d, e), GCPs isolated from rat cerebellum (P4) were electroporated with the GPR3/EGFP expression (bottom row, panel d) or control vector (top row, panel d). p27/kip1 expression was detected by immunohistochemistry, 48 hours later. EGFP and p27/kip1 doubly positive cells were counted in GPR3 and control groups (panel e). *p<0.01;**p<0.001, # p<0.0001, scale bar = 200 µm.
Figure 2
Figure 2. Endogenous GPR3 siRNA-mediated inhibition enhances Shh-induced rodent GCPs proliferation and inhibits p27/kip expression.
GCPs were isolated from rat cerebelli (P7) (n = 12–14 to obtain 108 neurons). Cells (5×10⁶) were electroporated with GPR3 (middle row, panel a) or control siRNA (top row, panel a). To visualize transfected cells, an EGFP expression vector was also co-transfected with each siRNA. Shh (1 µg/ml) was administrated 6 hours after. BrdU was added 12 hours prior to fixation. dbcAMP (100 µM) was used as a chemical cAMP activator and as a positive control (bottom row, panel a). In panel a, representative fields from dishes are visualized from the control siRNA+Shh group (top row), GPR3 siRNA+Shh group (middle row) and GPR3 siRNA+Shh+dbcAMP (bottom row). Visualization by BrdU immunohistochemistry (red dye), and EGFP fluorescence (green dye) and the combined merged image are shown. Five random fields were selected per each dish (n = 3) from the control siRNA+Shh, Shh+GPR3 siRNA and Shh+GPR3 siRNA+cAMP groups. The number of GFP-positive cells (representing positively transfected neurons) was counted (at least one hundred GFP-positive neurons per each field). Doubly labeled cells (yellow color) were also enumerated per each dish. Values were then expressed as the percentage of doubly-labeled cells out of total GFP positive cells in the Shh+GPR3 group or Shh+GPR3+dbcAMP groups compared to Shh group, i.e. % Shh-treated cells (panel b). In parallel, cell proliferation was also determined using an ELISA assay based on the measurement of BrdU incorporation during DNA synthesis (Panel C). For p27/kip expression, GPR3 siRNA or control siRNA were electroporated in P4 GCPs (panel d). The mRNA of GPR3 and p27/kip1 was analyzed by real time PCR, 48 hours after transfection and each value was normalized to beta-actin expression. The expression of GPR3 was reduced to approximate 40% of the control siRNA value and this inhibited p27/kip1 mRNA expression by 20%. # p<0.0001; *p<0.001, scale bar = 200 µm
Figure 3
Figure 3. GPR3 expression during postnatal rat and mouse cerebellar development.
Panel a: Total mRNA was extracted from rat cerebelli (N = 12–15 per time point) at 4 different developmental stages (P1, P7, P21) and adult (7 to 8 weeks). RNA samples were subjected to quantitative RT-PCR analysis using probes and primers specific to rat GPR3. Data were adjusted using β-actin mRNA as control. Panel b: To determine the distribution of GPR3 in the developing postnatal cerebellum, a GPR3−/−; LacZ +/+ mouse was employed, where the E. coli LacZ gene was substituted into the GPR3 locus and was thus under transcriptional control of the endogenous GPR3 promoter. Staining for β-galactosidase expression revealed increased activation of transcriptional activity of the GPR3 promoter in the internal granular layer of cerebellum from P5 to P12 stages of postnatal development. Scale bar = 100 µm.
Figure 4
Figure 4. Increased proliferation of granule precursor cells in the IGL of a GPR3−/− mouse.
In panel a, BrdU was administered to P14 GPR3−/− (right panel) or wild type mice (left panel) 4 hours prior to sacrifice. Sections (20 µm) were incubated with a rat anti-BrdU monoclonal antibody and FITC-labelled anti-rat secondary antibody. Fluorescent cells are indicated by arrows in the IGL of GPR3−/− mice but not in wild-type mice. As expected, meningeal cells on cerebellar surface also showed BrdU incorporation. In panel b, parallel sections were stained with an anti-ki67 antibody to detect proliferating cells in IGL. Positive Ki67 cells were visualized in IGL of GPR3−/− vs. wild-type mice. In panel c, merged images of Ki67 positive cells and βtubulin positive are shown in the right subpanel. White arrowheads point to doubly positive cells. Scale bar = 100 µm (panel a,b) and 20 µm (panel c).
Figure 5
Figure 5. The IGL of GPR3−/− mice is hyperproliferative and enlarged.
Wild-type and GPR3−/− mice were administered BrdU at P5. Thirteen days later, mice were sacrificed and cerebelli were stained with a BrdU antibody. In panel a, BrdU staining is shown primarily in IGL of wild-type and, even more so, of GPR3−/− mice. In panel b, BrdU positive cells in the IGL were enumerated in 9Cb lobe of wild-type vs. GPR3−/− mice. In panel c, IGL thickness was visually evaluated in wild-type vs. GPR3−/− mice (P14) after hematoxilyn and eosin stain. Thickness of the IGL in 9Cb lobe (P14) was measured in wild-type vs. GPR3−/− mice (P14). * = p<0.05; ** = p<0.01. Scale bar = 100 µm.
Figure 6
Figure 6. Expression of p27/kip and phosphoCREB expression during postnatal cerebellar development.
In panel a, cerebelli from GPR3−/− or wild type mice were harvested at P5, P8, and P14. p27/kip1 immunohistochemistry was detected in IGL (as well as other layers) but was visually more readily apparent in wild-type vs. GPR3−/− mice at all stages. In panel b, pCREB was detected by immunohistochemistry in wild-type and GPR3−/− mice (P12). While pCREB, was detected in the molecular layer (ML) and IGL of widl-type mice, it was not as readily visible in the IGL of the GPR3−/−. In panel c, co-localization of pCREB and p27/kip was determined by double immunofluorescence. Scale bar = 50 µm.

References

    1. Altman J. Postnatal development of the cerebellar cortex in the rat. II. Phases in the maturation of Purkinje cells and of the molecular layer. J Comp Neurol. 1972;145:399–463. - PubMed
    1. Altman J. Postnatal development of the cerebellar cortex in the rat. 3. Maturation of the components of the granular layer. J Comp Neurol. 1972;145:465–513. - PubMed
    1. Altman J. Postnatal development of the cerebellar cortex in the rat. I. The external germinal layer and the transitional molecular layer. J Comp Neurol. 1972;145:353–397. - PubMed
    1. Altman J, Bayer SA. Embryonic development of the rat cerebellum. I. Delineation of the cerebellar primordium and early cell movements. J Comp Neurol. 1985;231:1–26. - PubMed
    1. Burgoyne RD, Cambray-Deakin MA. The cellular neurobiology of neuronal development: the cerebellar granule cell. Brain Res. 1988;472:77–101. - PubMed

Publication types