. 2009 Jun 17;96(12):4764-78.
doi: 10.1016/j.bpj.2009.02.060.

A mathematical analysis of obstructed diffusion within skeletal muscle

Affiliations

A mathematical analysis of obstructed diffusion within skeletal muscle

P R Shorten et al. Biophys J. .

Abstract

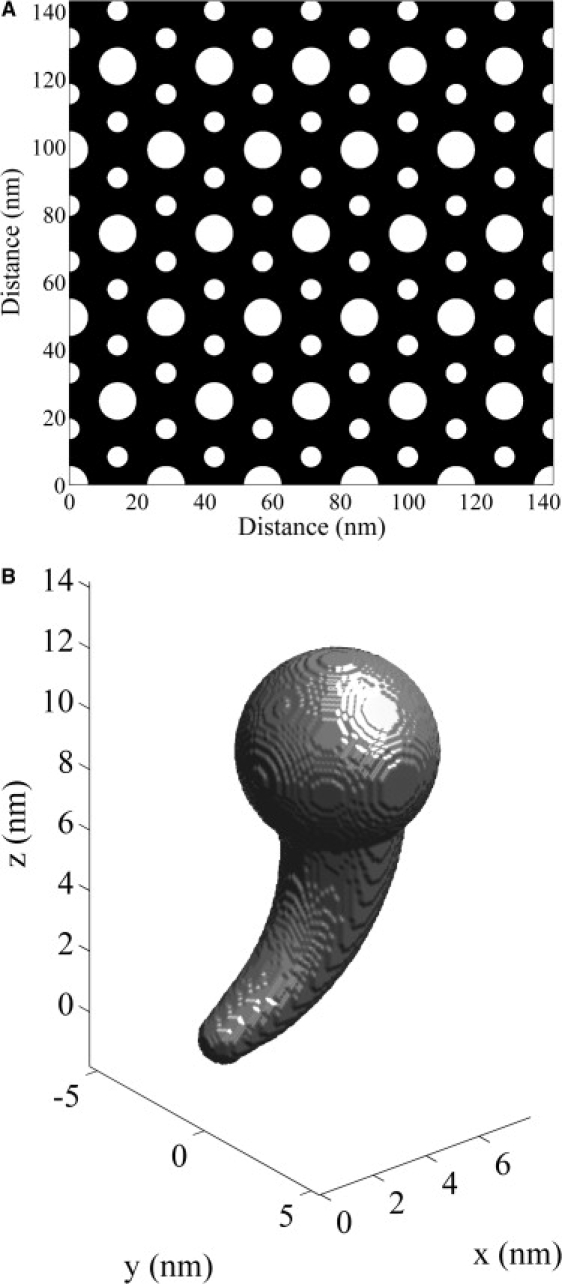
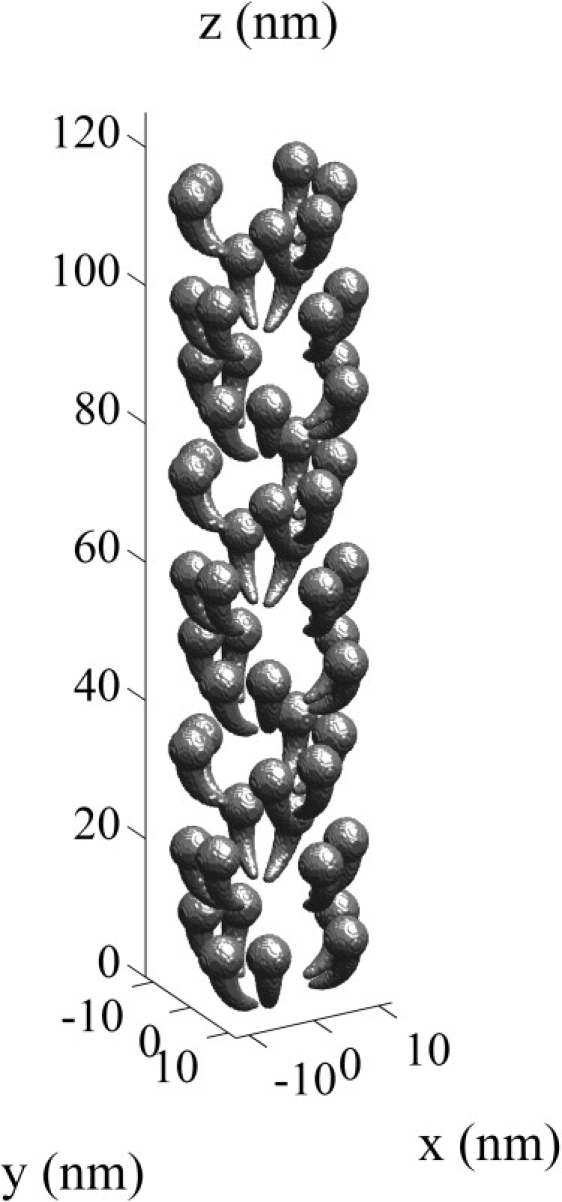
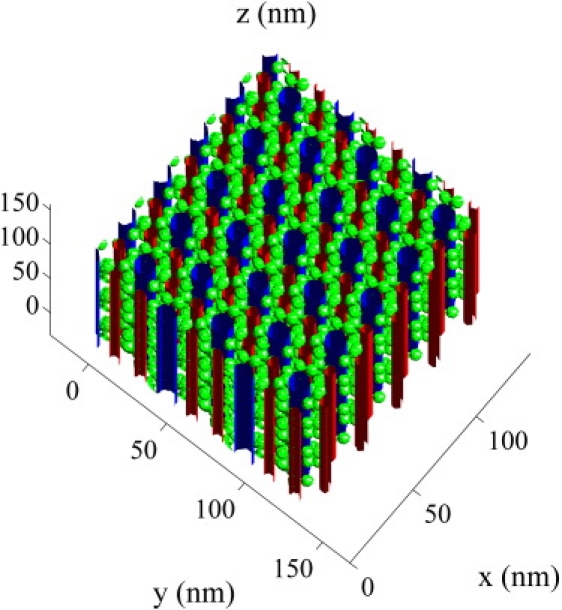
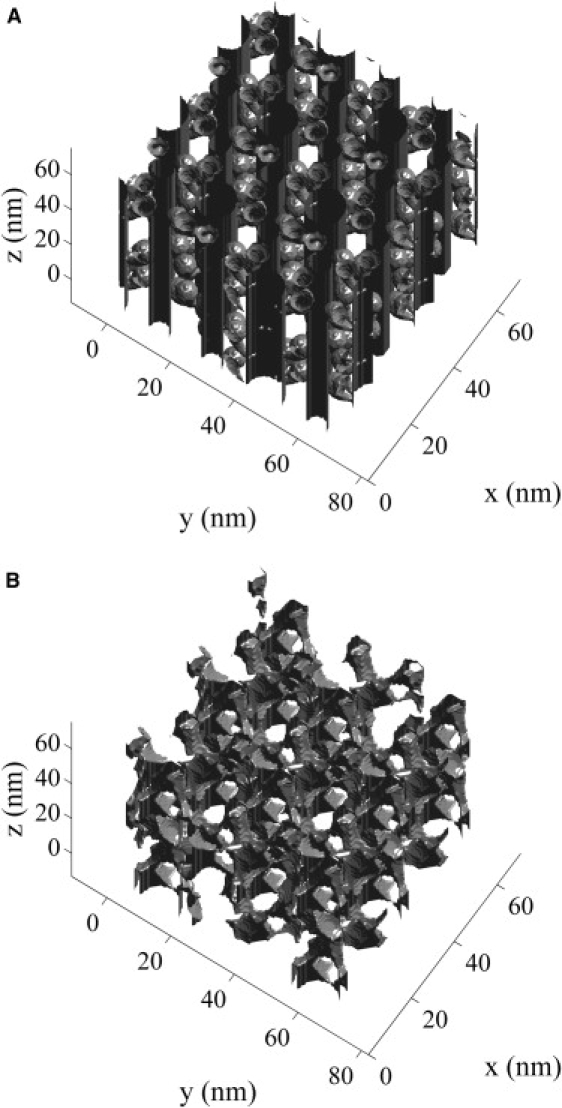
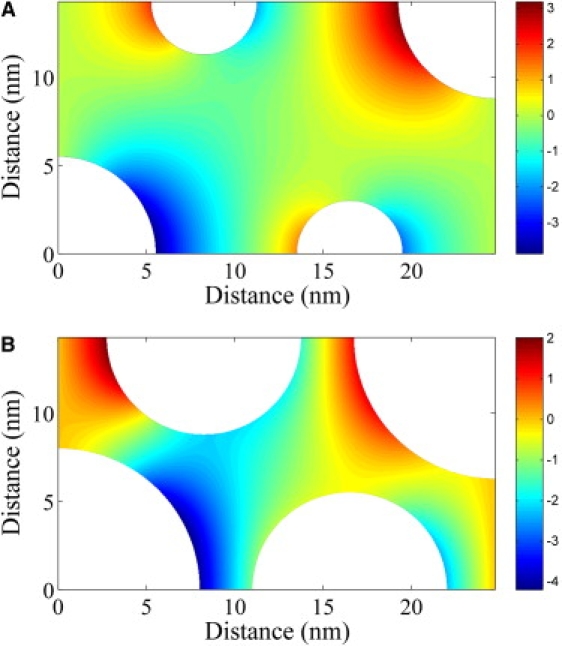
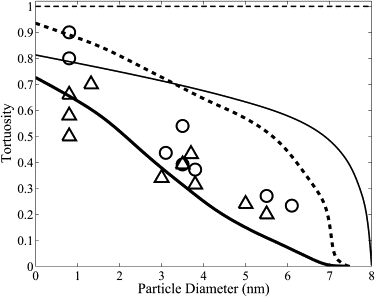
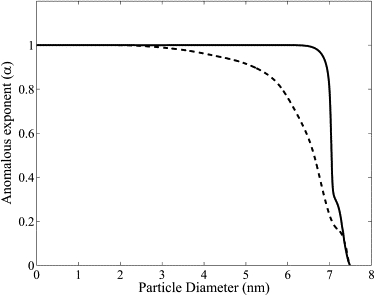
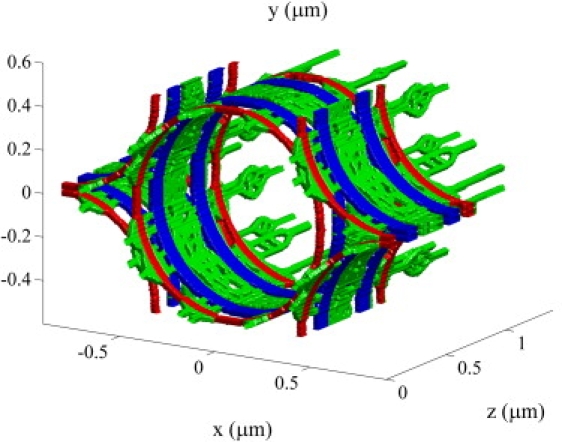
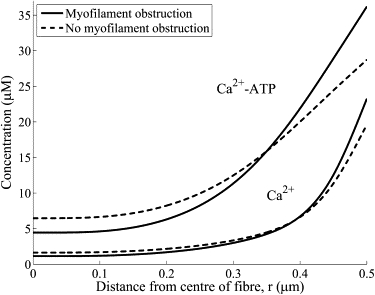
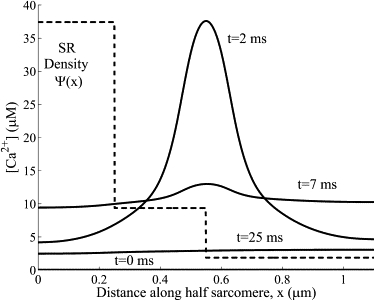
Molecules are transported through the myofilament lattice of skeletal muscle fibers during muscle activation. The myofilaments, along with the myosin heads, sarcoplasmic reticulum, t-tubules, and mitochondria, obstruct the diffusion of molecules through the muscle fiber. In this work, we studied the process of obstructed diffusion within the myofilament lattice using Monte Carlo simulation, level-set and homogenization theory. We found that these intracellular obstacles significantly reduce the diffusion of material through skeletal muscle and generate diffusion anisotropy that is consistent with experimentally observed slower diffusion in the radial than the longitudinal direction. Our model also predicts that protein size has a significant effect on the diffusion of material through muscle, which is consistent with experimental measurements. Protein diffusion on the myofilament lattice is also anomalous (i.e., it does not obey Brownian motion) for proteins that are close in size to the myofilament spacing. The obstructed transport of Ca2+ and ATP-bound Ca2+ through the myofilament lattice also generates smaller Ca2+ transients. In addition, we used homogenization theory to discover that the nonhomogeneous distribution in the troponin binding sites has no effect on the macroscopic Ca2+ dynamics. The nonuniform sarcoplasmic reticulum Ca2+-ATPase pump distribution also introduces small asymmetries in the myoplasmic Ca2+ transients.


Figures

Figure 1
Figure 1
(A) The myofilament lattice geometry. The actin myofilaments are larger in diameter than the myosin myofilaments. (B) The myosin head geometry.
Figure 2
Figure 2
The location of the myosin heads on a single actin myofilament.
Figure 3
Figure 3
The three-dimensional myofilament lattice geometry.
Figure 4
Figure 4
(A) The boundary of the myoplasmic void space (Ω). (B) The boundary of the restricted myoplasmic void space for a 6-nm spherical particle (Ω6) calculated using the level-set equation (Eq. 7).
Figure 5
Figure 5
(A) The numerical solution of Eq. 5 for a point particle with e^i aligned with the x axis for the myofilament geometry excluding the myosin heads. The tortuosity factor is τ=0.79. (B) The numerical solution of Eq. 5 for a protein of diameter 5 nm with e^i aligned with the x axis for the myofilament geometry excluding the myosin heads. The tortuosity factor is τ=0.63.
Figure 6
Figure 6
The model effect of protein size on radial tortuosity (τx) in a myofilament lattice with (thick line) and without (thin line) the myosin heads, along with the effect of protein size on longitudinal tortuosity (τz) in a myofilament lattice with (thick dotted line) and without (thin dotted line) the myosin heads. Also shown are experimental measurements in skeletal muscle of the effect of protein size on the radial tortuoisty factor (Δ) (6,8,30,31,33) and the longitudinal tortuosity factor (○) (7,8,33). Protein size has a significant effect of tortuosity.
Figure 7
Figure 7
The relationship between the protein diameter (d) and the anomalous diffusion exponent (α) in radial (dotted line) and longitudinal (solid line) directions.
Figure 8
Figure 8
The structure of the mitochondria (blue), t-tubules (red), and SR (green) in slow-twitch fibers based on the reconstruction by Ogata and Yamasaki (36).
Figure 9
Figure 9
The effect of obstructed diffusion due to the myofilaments on the myoplasmic Ca2+ transients. Shown are typical Ca2+ and ATP-bound Ca2+ (Ca2+-ATP) transients (solid line) that account for the obstructed diffusion along with the transients without obstructed diffusion (dotted line). Transients are shown for x = 0.55 μm (i.e,. at the terminal cisternae) and t = 0.5 ms. The myofilament lattice significantly obstructs the transport of Ca2+ and ATP-bound Ca2+ into the myoplasm.
Figure 10
Figure 10
The myoplasmic Ca2+ distribution near the surface of the SR (r = R). The nonuniform SR Ca2+-ATPase pump distribution (dotted line) introduces very small asymmetries in the myoplasmic Ca2+ transients (solid line).

References

    1. Mathias R.T., Eisenberg R.S., Valdiosera R. Electrical properties of frog skeletal muscle fibers interpreted with a mesh model of the tubular system. Biophys. J. 1977;17:57–93. - PMC - PubMed
    1. Mathias R.T. Effect of tortuous extracellular pathways on resistance measurements. Biophys. J. 1983;42:55–59. - PMC - PubMed
    1. El-Kareh A.W., Braunstein S.L., Secomb T.W. Effect of cell arrangement and interstitial volume fraction on the diffusivity of monoclonal antibodies in tissue. Biophys. J. 1993;64:1638–1646. - PMC - PubMed
    1. Friedrich O., Ehmer T., Uttenweiler D., Vogel M., Barry P.H. Numerical analysis of Ca2+ depletion in the transverse tubular system of mammalian muscle. Biophys. J. 2001;80:2046–2055. - PMC - PubMed
    1. Engel J., Fechner M., Sowerby A.J., Finch S.A.E., Stier A. Anisotropic propagation of Ca2+ waves in isolated cardiomyocytes. Biophys. J. 1994;66:1756–1762. - PMC - PubMed

Publication types

LinkOut - more resources