. 2009 Jun 17;96(12):5060-72.
doi: 10.1016/j.bpj.2009.03.032.

Topography and nanomechanics of live neuronal growth cones analyzed by atomic force microscopy

Affiliations

Topography and nanomechanics of live neuronal growth cones analyzed by atomic force microscopy

Ying Xiong et al. Biophys J. .

Abstract

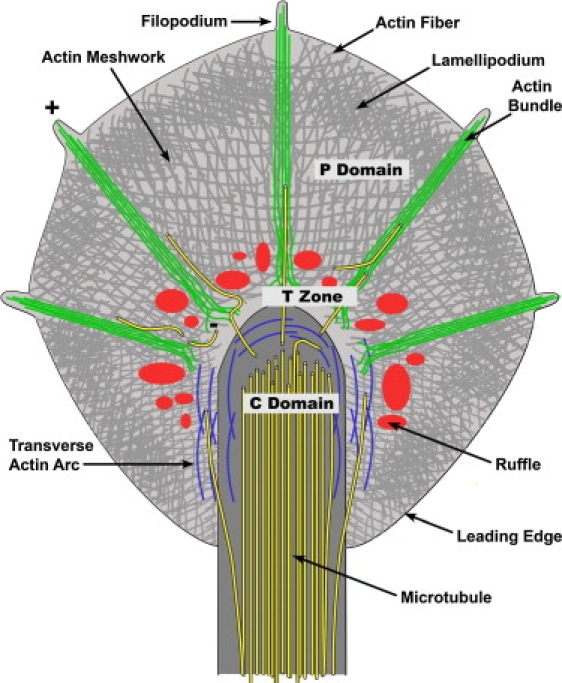
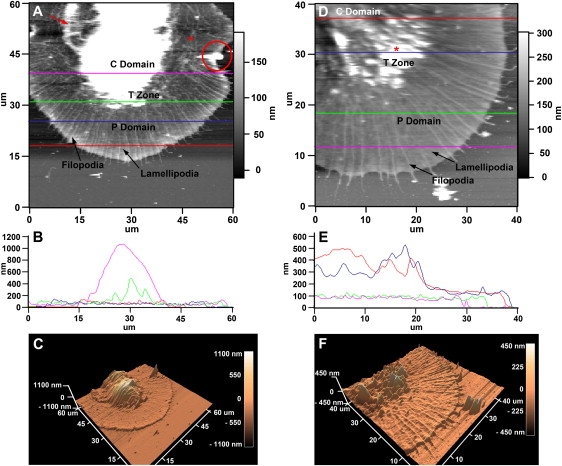
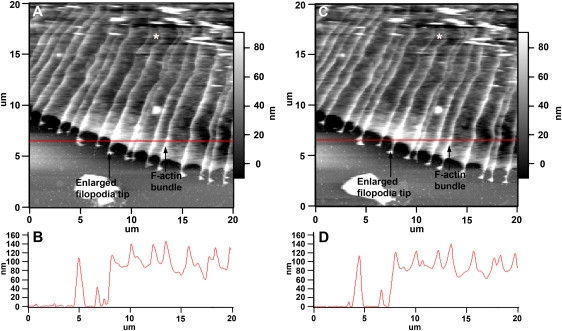
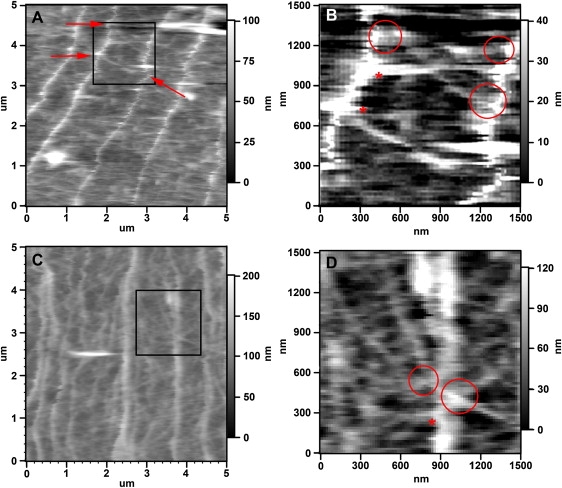
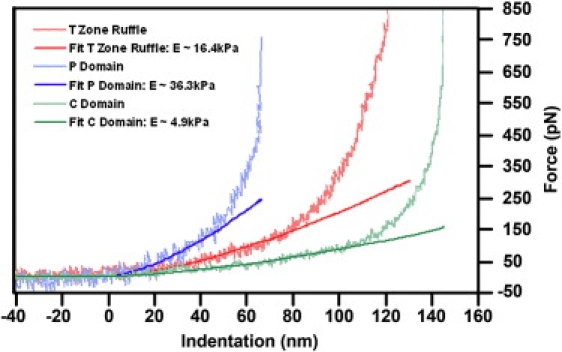
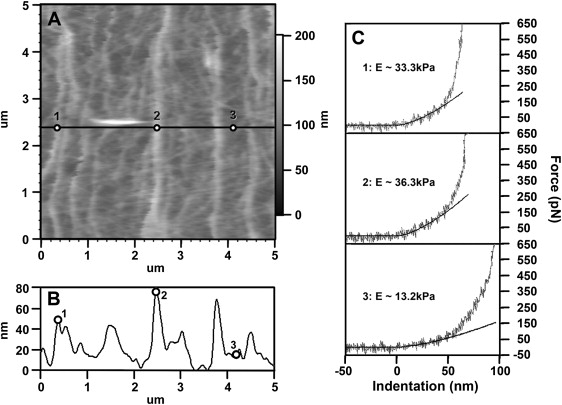
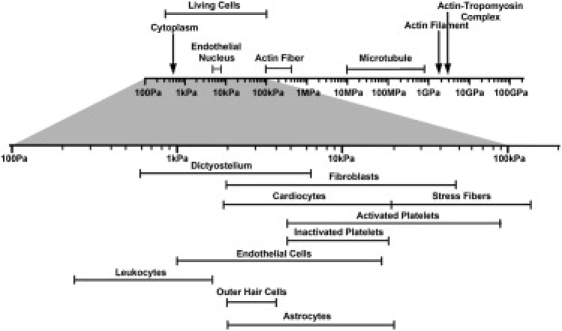
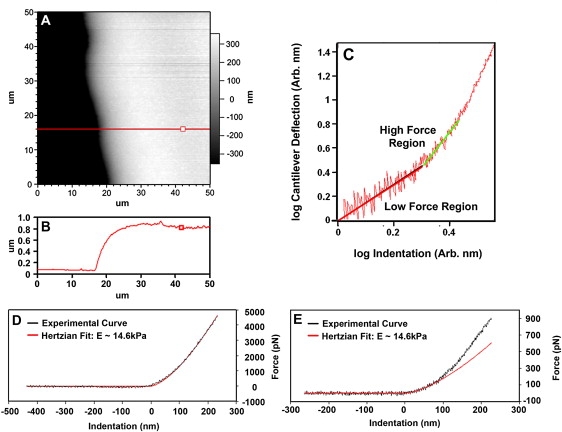
Neuronal growth cones are motile structures located at the end of axons that translate extracellular guidance information into directional movements. Despite the important role of growth cones in neuronal development and regeneration, relatively little is known about the topography and mechanical properties of distinct subcellular growth cone regions under live conditions. In this study, we used the AFM to study the P domain, T zone, and C domain of live Aplysia growth cones. The average height of these regions was calculated from contact mode AFM images to be 183 +/- 33, 690 +/- 274, and 1322 +/- 164 nm, respectively. These findings are consistent with data derived from dynamic mode images of live and contact mode images of fixed growth cones. Nano-indentation measurements indicate that the elastic moduli of the C domain and T zone ruffling region ranged between 3-7 and 7-23 kPa, respectively. The range of the measured elastic modulus of the P domain was 10-40 kPa. High resolution images of the P domain suggest its relatively high elastic modulus results from a dense meshwork of actin filaments in lamellipodia and from actin bundles in the filopodia. The increased mechanical stiffness of the P and T domains is likely important to support and transduce tension that develops during growth cone steering.


Figures

Figure 1
Figure 1
Schematic of growth cone cytoplasmic and cytoskeletal organization. The C and P domains are separated by the T zone. The C domain contains a high density of stable microtubules (yellow) serving as structural support for axon elongation and substrates for fast axonal transport of organelles into the growth cone. The tips of microtubules extending beyond the T zone into the P domain are highly dynamic and continuously explore the actin-rich periphery via stochastic assembly and disassembly, using the F-actin bundles as polymerization guides. The P domain consists of alternating lamellipodia and filopodia regions, with highly polarized actin bundles in the filopodia (green), and more randomly oriented actin networks in the lamellipodia (gray). F-actin assembly along the leading edge of lamellipodia and in the tips of filopodia is balanced by myosin-driven retrograde actin flow. Transverse actin arcs (blue) undergoing Rho-dependent contractility are located in the T zone around the C domain. Also, in the T zone de novo actin assembly occurs in ruffling structures (red), also named intrapodia. Adapted from Schaefer et al. (12).
Figure 2
Figure 2
Low-resolution CM and DM measurements on Aplysia growth cones. (A) CM AFM image with labeled P domain, T zone, and C domain. (B) Color-coded cross sections from the fast scan lines identified in A. Average P domain heights are around 100 nm (red and blue line), whereas average T zone ruffling heights are between 200–400 nm in this example (green line). The highest region of this growth cone was detected in the C domain (magenta line). (C) Three-dimensional reconstruction of the grown cone shown in A. (D) DM AFM image of a different growth cone. The relative height differences between individual growth cone regions were consistent with data acquired from CM images. (E) Cross sections through different regions of the growth cone shown in D. (F) Three-dimensional reconstruction of the growth cone shown in D. Scales are indicated.
Figure 3
Figure 3
High resolution DM images of the P domain. (A) High resolution scan trace image (scanning direction from left to right) of the leading edge of a growth cone. Elevated F-actin bundles and enlarged filopodia tips are labeled. Dynamic ruffles in the T zone can be identified as small, elevated structures at the upper right corner of the image. (B) The cross section along the scan line in A shows a height difference of 30–50 nm between F-actin bundles and their surrounding lamellipodia. (C) The retrace image (scanning direction from right to left) of the same scan shows filopodial structures that are very similar to those shown in A, suggesting that the imaging force did not perturb filopodia integrity. (D) The height profile of the cross section in the retrace image (C) is very consistent with the profile (B) of the trace image (A).
Figure 4
Figure 4
High resolution analysis of filopodial actin bundles and lamellipodial actin networks in the P domain. (A and C) High resolution DM images showing details of the filopodia actin bundles and actin meshwork structures in different growth cones. The filaments in the actin network are less interconnected in A when compared to C. In both images, the individual filaments of the meshwork are thinner and less oriented than the filopodial actin bundle running from top to bottom. (B and D) Magnifications of boxed areas in A and C, respectively. Asterisks indicate potential connections between lamellipodial actin meshwork and filopodial actin bundles. Arrows indicate locations where kinks in bundles correlate with connecting lamellipodial actin structures. Scales are indicated.
Figure 5
Figure 5
Force curves measured in different growth cone regions. Young's modulus of the P domain, T zone ruffling region, and C domain were determined from the low-load regions of the force curves to be 36.3 kPa, 16.4 kPa, and 4.9 kPa, respectively. Indentation of the P domain at forces of >400 pN becomes saturated. This load corresponds to an indentation of ∼65 nm, which is ∼1/3 of the thickness of the P domain. This is consistent with previous thin film mechanical indentation measurements (75,78). For the thicker C domain, this saturation behavior occurs at an indentation depth of ∼140 nm, which appears at a loading force >600 pN. From the force curve measured on top of the T zone ruffles, which is both thick and relatively stiff, this saturation is barely visible at a indentation of ∼120 nm with a loading force >800 pN, due to the restriction of the upper limit of the loading force applied in our experiments. Low loading force curves plotted on a linear scale from these three cytoplasmic regions (wavy lines) and their corresponding Hertzian contact model fits (solid lines) were consistent with each other in the 50 nm indentation range.
Figure 6
Figure 6
Force curve analysis shows that filopodial actin bundles are stiffer than lamellipodial actin meshwork structures. (A) High resolution DM image of P domain actin bundles and meshwork. Force curves were measured using the same AFM tip on three different positions indicated in A: position 1 and 2 on top of filopodial actin bundles with different heights, and position 3 on top of lamellipodial actin meshwork between bundles. (B) Height profile of the cross section made through these three points indicated by the black line in A. (C) Corresponding force curves taken at these three positions marked in A and their corresponding Hertzian contact model fits within 50 nm indentation range. The resulting Young's moduli have consistently higher values on top of actin bundles regardless of the height differences existing between these bundles (1 and 2, ∼33.3 kPa and 36.3 kPa, respectively), when compared to the meshwork filaments (3, ∼13.2 kPa).
Figure 7
Figure 7
Frequency-dependent hysteresis in the T zone. (A) Force curve measured in the T zone at 1 Hz rate showing hysteresis behavior seen between the approaching (top) and retracting (bottom) parts of the force curve with a sudden decrease in apparent stiffness in the approaching part of the force curve. (B) Force curve measured at 0.1 Hz at the identical position with no apparent hysteresis behavior. The stiffness determined from B is also slightly lower than the one measured from (A).
Figure 8
Figure 8
Young's moduli of different structural components in live cells. Previous studies on different cellular structural components have suggested that most of these structures have a much higher mechanical stiffness than the ones exhibited by the cells as a whole (in the range of 500 Pa–100 kPa). For example, AFM-based single-cell compression studies suggested the stretching elasticity of live cell membrane lies in the range of 10–35 MPa (81). Young's modulus of single actin filament deduced from thermal fluctuation studies of its flexural rigidity is ∼2.6 GPa (66), whereas studies indicated that single microtubule has a Young's modulus in the range of 10 MPa–1 GPa (82).
Figure 9
Figure 9
Force-indentation curves measured on agarose and demonstration of scaling analysis. (A) AFM image of an area near the edge of a thin agarose gel film (0.5% bacterial agar) scanned in 50% isopropanol. (B) The thickness of this film can be identified in the cross section. (C) A log (cantilever deflection) versus log (indentation) representation of a force curve measured with a 50-nm radius Biolever probe on a ∼700 nm agarose film. The log-log plot clearly indicated a change in the slope from 1 to 1.5 and 1.5 to 2. (D) Force curve measured with a Mikromasch CSC12/No Al tipless cantilever modified with 5-μm diameter silica microsphere. This force curve followed a 1.5 order power law consistent with a spherical Hertzian indentor throughout the range of the measurement. (E) Linear representation of the Biolever force-indentation curve that was only consistent with a spherical Hertzian fit for the first 50 nm of indentation. The Young's modulus measured with the Biolever and 5-μm diameter silica microsphere were consistent with each other as well as with previous measurements made on similar gel films (75,78).

Similar articles

Cited by

References

    1. Charron F., Tessier-Lavigne M. Novel brain wiring functions for classical morphogens: a role as graded positional cues in axon guidance. Development. 2005;132:2251–2262. - PubMed
    1. Dickson B.J. Molecular mechanisms of axon guidance. Science. 2002;298:1959–1964. - PubMed
    1. Song H., Poo M. The cell biology of neuronal navigation. Nat. Cell Biol. 2001;3:E81–E88. - PubMed
    1. Huber A.B., Kolodkin A.L., Ginty D.D., Cloutier J.F. Signaling at the growth cone: ligand-receptor complexes and the control of axon growth and guidance. Annu. Rev. Neurosci. 2003;26:509–563. - PubMed
    1. Dent E.W., Gertler F.B. Cytoskeletal dynamics and transport in growth cone motility and axon guidance. Neuron. 2003;40:209–227. - PubMed

Publication types

LinkOut - more resources