Review
. 2009 Jul 27;364(1526):1985-98.
doi: 10.1098/rstb.2008.0205.

Accumulation and fragmentation of plastic debris in global environments

Affiliations
Review

Accumulation and fragmentation of plastic debris in global environments

David K A Barnes et al. Philos Trans R Soc Lond B Biol Sci. .

Abstract

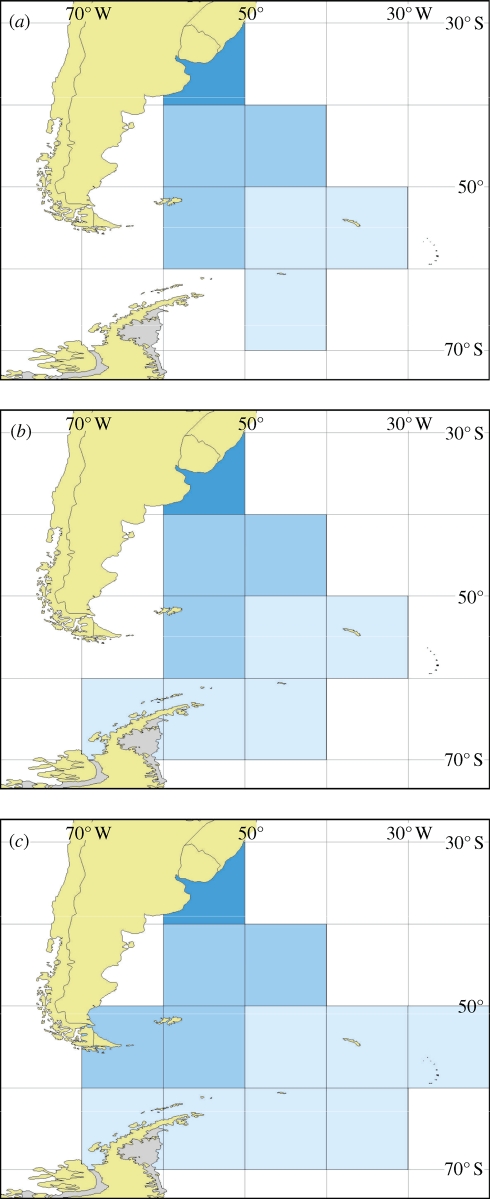
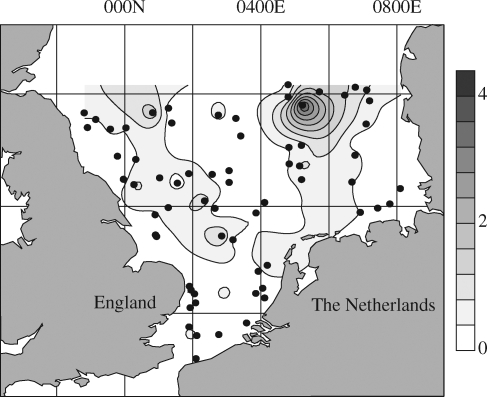
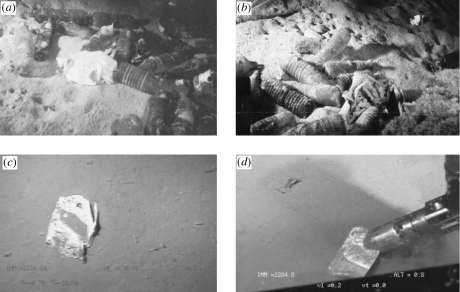
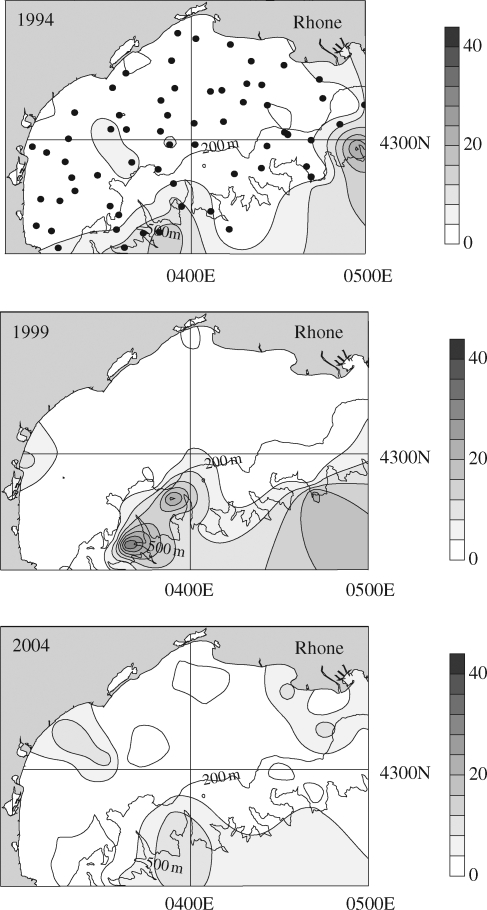
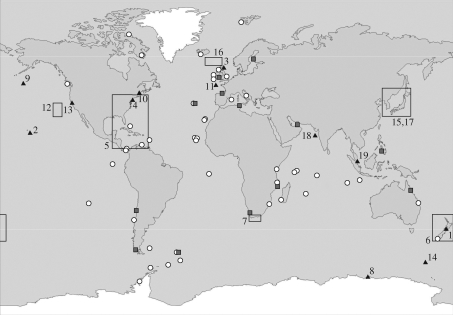
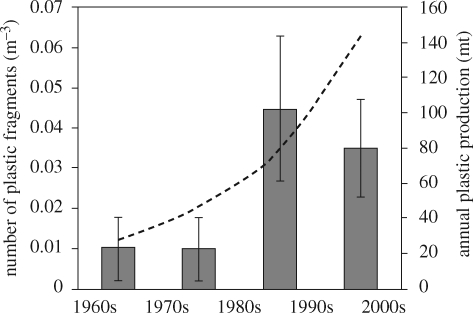
One of the most ubiquitous and long-lasting recent changes to the surface of our planet is the accumulation and fragmentation of plastics. Within just a few decades since mass production of plastic products commenced in the 1950s, plastic debris has accumulated in terrestrial environments, in the open ocean, on shorelines of even the most remote islands and in the deep sea. Annual clean-up operations, costing millions of pounds sterling, are now organized in many countries and on every continent. Here we document global plastics production and the accumulation of plastic waste. While plastics typically constitute approximately 10 per cent of discarded waste, they represent a much greater proportion of the debris accumulating on shorelines. Mega- and macro-plastics have accumulated in the highest densities in the Northern Hemisphere, adjacent to urban centres, in enclosed seas and at water convergences (fronts). We report lower densities on remote island shores, on the continental shelf seabed and the lowest densities (but still a documented presence) in the deep sea and Southern Ocean. The longevity of plastic is estimated to be hundreds to thousands of years, but is likely to be far longer in deep sea and non-surface polar environments. Plastic debris poses considerable threat by choking and starving wildlife, distributing non-native and potentially harmful organisms, absorbing toxic chemicals and degrading to micro-plastics that may subsequently be ingested. Well-established annual surveys on coasts and at sea have shown that trends in mega- and macro-plastic accumulation rates are no longer uniformly increasing: rather stable, increasing and decreasing trends have all been reported. The average size of plastic particles in the environment seems to be decreasing, and the abundance and global distribution of micro-plastic fragments have increased over the last few decades. However, the environmental consequences of such microscopic debris are still poorly understood.


Figures

Figure 1.
Figure 1.
Production of plastic products in the USA in 2005 (reproduced with permission from US EPA, 2006).
Figure 2.
Figure 2.
Annual accumulation of all marine debris (predominantly plastic) on shores of selected islands with year. Data for Bird I. and Signy I. are from Walker et al. (1997); Convey et al. (2002) and CCAMLR. Data for Tern I. are from Morishige et al. (2007) and for the UK from Beachwatch 2006 (MCS 2007).
Figure 3.
Figure 3.
Densities of all marine debris, predominantly plastic, at sea in the southwest Atlantic and Atlantic sector of the Southern Ocean by 10° latitude and longitude areas. Shades of light to dark blue code for [r1]densities 0–1, 2–10, 11–100, 101–1000 and 1001+ items square kilometre, respectively. The survey years are (a) April 1993, (b) April 2002 and (c) April 2006. Data from Barnes & Milner (2005) and reported here for the first time.
Figure 4.
Figure 4.
Plastic debris on the seabed from the southern North Sea (North Atlantic) in 1999. Plastics were counted after 30 min trawl time (16 m mouth, 20 mm mesh) at 64 stations (•) on the continental shelf. Results are given as items Ha–1 (10 000 m2).
Figure 5.
Figure 5.
Accumulation of debris in deep sea environments. Submersible observations in Mediterranean canyons (a and b: plastic bottles at 1000 m depth at two different locations in the Marseille canyon, 43°03′00″ N, 05°00′00″ E) and above the polar circle, under ice floe (c and d: individual plastic bags, 2200–2600 m depth at Hausgarten, Fram strait, 79°03′80″ N, 04°11′60″ E).
Figure 6.
Figure 6.
Plastic debris on the sea floor from the Gulf of Lion (Mediterranean Sea, France) between 1994 and 2004. Plastics were counted after 60 min trawl time (net = 16 m mouth, 10 mm mesh) at 65 stations (•) located on the continental shelf and adjacent canyons (down to 800 m) from the gulf. Results are given as items Ha–1 (10 000 m2). Top plot shows the sampling stations from 1994–2004.
Figure 7.
Figure 7.
Reports of plastic fragments in the marine environment presented in chronological order: 1, Harper & Fowler (1987) report on plastic (mainly pre-production pellets) ingested by seabirds since 1960; 2, plastic fragments found in body cavity of dead laysan albatrosses during 1966 survey (Kenyon & Kridler 1969); 3, synthetic fibres in medium plankton net hauls (size not specified) (Buchanan 1971); 4, polystyrene spherules (average 500 µm) in coastal waters (Carpenter et al. 1972); 5, particles, spheres and discs (1–5 mm) in surface waters (Colton et al. 1974); 6, resin pellets (approx. 5 mm) on shoreline (Gregory 1978); 7, temporal trends in abundance and composition of plastic on beaches 1984–1989 (Ryan & Moloney 1990); 8, plastic particles (approx. 3 mm) in gut of storm petrels (van Franeker & Bell 1988); 9, fragments (≥500 µm) at sea surface (Shaw & Day 1994); 10, micro-plastic fibres (≥20 µm) in sewage sludge (Habib et al. 1996); 11, fragments in deep sea (size not specified) (Galgani et al. 2000); 12, fragments (≥350 µm) at sea surface (Moore et al. 2001a); 13, fragments and resin pellets on shoreline (size not specified) (Moore et al. 2001b); 14, fragments (≥1 mm) in scats of fur seals (Eriksson & Burton 2003); 15, fragments (≥1 mm) on beaches (Kusui & Noda 2003); 16, micro-plastics (≥20 µm) in surface waters and on beaches (Thompson et al. 2004); 17, resin pellets (approx. 5 mm) on beaches (Endo et al. 2005); 18, micro-plastics (≥10 µm) on shorelines near ship breaking yards (Reddy et al. 2006); 19, micro-plastics in surface waters and sediments (≥1.6 µm) (Ng & Obbard 2006). Red squares show distribution of micro-plastics (≥ 20 µm) in intertidal sediments (R. C. Thompson et al. 2003–2007 unpublished data). White dots show mega- and macro-plastic strandline surveys (Barnes 2002, 2005).
Figure 8.
Figure 8.
Microscopic plastic in surface waters, collected with continuous plankton recorder, revealed a significant increase in abundance when samples from the 1960s and 1970s were compared with the 1980s and 1990s (F3,3 = 14.42, p < 0.05). Global production of plastic overlain for comparison (APME 2006). Grey boxes, number of plastic fibres (m−3); dashed line, plastic produced per year (million tonnes). (Reproduced with permission from Thompson et al. 2004.)

References

    1. Acha E., Hermes W., Mianzan A., Iribarne C., Domingo A., Gagliardini C., Carlos Lasta A., Pedro Daleo D.2003The role of the Rıo de la Plata bottom salinity front in accumulating debris. Mar. Pollut. Bull. 46, 197–202 (doi:10.1016/cS0025-326X(02)00356-9) - DOI - PubMed
    1. Andrady A. L.2003Plastics in the environment. In Plastics in the environment (ed. Andrady A. L.), p. 762 New Jersey, NJ: John Wiley & Sons
    1. Andrady A. L., Neal M. A.2009Applications and societal benefits of plastics. Phil. Trans. R. Soc. B 364, 1977–1984 (doi:10.1098/rstb.2008.0304) - DOI - PMC - PubMed
    1. APME 2006An analysis of plastics production, demand and recovery in Europe Brussels, Belgium: Association of Plastics Manufacturers
    1. Barlaz M. A.2006Forest products decomposition in municipal solid waste landfills. Waste Manag. 26, 321–333 (doi:10.1016/j.wasman.2005.11.002) - DOI - PubMed

MeSH terms