. 2009 Jul;37(Web Server issue):W57-62.
doi: 10.1093/nar/gkp404. Epub 2009 Jun 15.

OmicBrowse: a Flash-based high-performance graphics interface for genomic resources

Affiliations

OmicBrowse: a Flash-based high-performance graphics interface for genomic resources

Akihiro Matsushima et al. Nucleic Acids Res. 2009 Jul.

Abstract

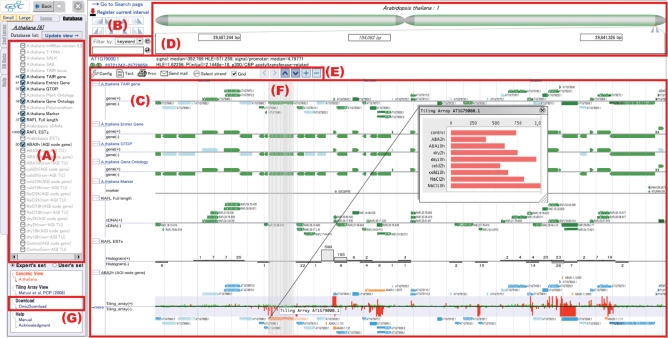
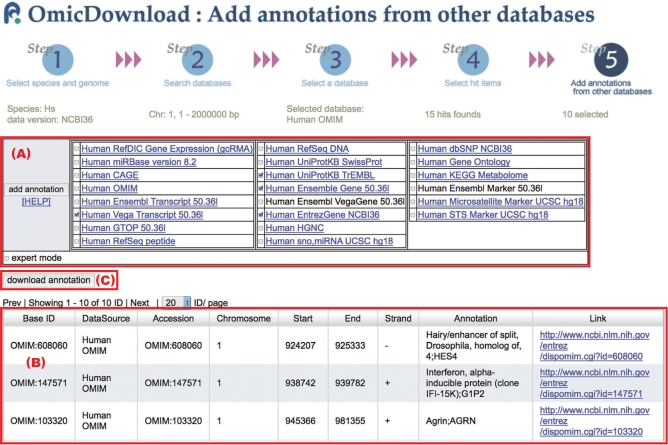
OmicBrowse is a genome browser designed as a scalable system for maintaining numerous genome annotation datasets. It is an open source tool capable of regulating multiple user data access to each dataset to allow multiple users to have their own integrative view of both their unpublished and published datasets, so that the maintenance costs related to supplying each collaborator exclusively with their own private data are significantly reduced. OmicBrowse supports DAS1 imports and exports of annotations to Internet site servers worldwide. We also provide a data-download named OmicDownload server that interactively selects datasets and filters the data on the selected datasets. Our OmicBrowse server has been freely available at http://omicspace.riken.jp/ since its launch in 2003. The OmicBrowse source code is downloadable from http://sourceforge.net/projects/omicbrowse/.


Figures

Figure 1.
Figure 1.
An example data view of OmicBrowse client. In this example, the set of data including seven databases is the genomic interval of length 100 000 bp located at chromosome 1 from 29 687 244 bp to 29 841 326 bp of the genome sequence tair 6 in Arabidopsis. First, (A) is a list of databases mapped to the genome sequence tair 6 of Arabidopsis. It allows users to select databases that they would like to view in the annotation viewer (C). By specifying a keyword or an ontology term in (B), only the annotation data having the keyword or the ontology term is displayed in (C), respectively. The annotation viewer (C) provides an integrated view of annotation data stored in the selected databases in (A) and located in the interval specified in the interval selector (D). The interval selector (D) allows a user to select an interval on the currently displayed chromosome. The length of interval specified in (D) is from 20 bp to whole chromosome. The control bar (E) provides icons respecting functions that control the annotation viewer (C), such as icons for launching the sequence viewer in text format, printing the current view, sending a URL indicating the current view via an e-mail to other users. The sequence viewer allows the user to download the data currently displayed in (C). The control bar also includes panel scrolling buttons indicated by arrowheads <,>, ∨ and ∧, and panel magnification buttons indicated by + and −. When the mouse cursor is located over the data item having an exon–intron structure, vertical lines that indicate the structure are displayed as (F) in order to compare other structured data located in the same genomic interval. On the annotation data display in the annotation viewer (C), a histogram is automatically generated when too many data are located in the interval to display, such as the RAFL ESTs database displayed in the second last line of this example. By clicking a histogram bar, the interval is set from the start address to the end address of that histogram bar. OmicBrowse supports numerical values mapped to the chromosomal axis. The last line of this example shows a dataset of tiling array in Arabidopsis and a result of the ARabidopsis Tiling Array-based Detection of Exons (ARTADE) (4) program which statistically predicts an exon–intron structure utilizing the dataset of the tiling array. The tiling array data are displayed as a bar chart in green and red that indicate whether the data are greater or lower than a threshold. The reference gene and predicted genes with the exon–intron structure are shown just outside of the bar chart. By selecting a gene, the stress intensity data of the tiling array of the gene is displayed in a pop-up window. A link to launch OmicDownload is displayed in the user's menu (G).
Figure 2.
Figure 2.
A screen grab of the data download wizard accessing our OmicDownload server. OmicDownload provides an interactive interface for the users to navigate through a data download procedure consisting the following five steps: (Step 1) selection of species and genome version, (Step 2) search of databases with the user's keyword and chromosomal interval related to the species and the genome version selected in Step 1, (Step 3) selection of a database from the set of databases selected in Step 2, (Step 4) selection of items that satisfy user's keyword and chromosomal interval specified in Step 2 in the database selected in Step 3 and (Step 5) selection of other databases that satisfy Step 1 for each item selected in Step 4, in order to download other items located in the chromosomal interval of the selected item. This figure is a screen grab of Step 5 reached by specifying the following parameters: (Step 1) H. sapiens (Hs) and NCBI36 were selected for species and genome version, respectively, (Step 2) chromosome 1, from 1 Mbp to 2 Mbp was specified as the chromosomal interval, (Step 3) Human OMIM was selected as the database, and 15 records of Human OMIM were found, (Step 4) 10 records were selected by the user from the 15 records obtained in Step 3. In Step 5, four databases related to species Hs and genome version NCBI36 are shown in the database selection table (A). In the annotation table (B), the annotation of the focused Human OMIM record OMIM:608060 is displayed on the top, and other records stored in the selected databases in (A) and located in the chromosomal interval of OMIM:608060 (Chromosome 1, from 924 207 bp to 925 333 bp) are followed. For the other nine records selected in Step 4, related annotation records are displayed as well as for OMIM:608060. Finally, by clicking the download annotation button (C), all annotation data listed in (B) for the 10 records selected in Step 4 are downloaded in a tab separated values (TSV) format.

Similar articles

Cited by

References

    1. Toyoda T, Wada A. Omic space: coordinate-based integration and analysis of genomic phenomic interactions. Bioinformatics. 2004;20:1759–1765. - PubMed
    1. The RIKEN Genome Exploration Research Group Phase II Team and the FANTOM Consortium. Functional annotation of a full-length mouse cDNA collection. Nature. 2001;409:685–690. - PubMed
    1. Sakurai T, Satou M, Akiyama K, Iida K, Seki M, Kuromori T, Ito T, Konagaya A, Toyoda T, Shinozaki K. RARGE: a large-scale database of RIKEN Arabidopsis resources ranging from transcriptome to phenome. Nucleic Acids Res. 2005;33:D647–D650. - PMC - PubMed
    1. Toyoda T, Shinozaki K. Tiling array-driven elucidation of transcriptional structures based on maximum-likelihood and Markov models. Plant J. 2005;43:611–621. - PubMed
    1. Maglott D, Ostell J, Pruitt KD, Tatusova T. Entrez Gene: gene-centered information at NCBI. Nucleic Acids Res. 2005;33:D54–D58. - PMC - PubMed

Publication types