. 2009 Aug;37(15):4955-64.
doi: 10.1093/nar/gkp504. Epub 2009 Jun 15.

Differential Spo0A-mediated effects on transcription and replication of the related Bacillus subtilis phages Nf and phi29 explain their different behaviours in vivo

Affiliations

Differential Spo0A-mediated effects on transcription and replication of the related Bacillus subtilis phages Nf and phi29 explain their different behaviours in vivo

Virginia Castilla-Llorente et al. Nucleic Acids Res. 2009 Aug.

Abstract

Members of groups 1 (e.g. 29) and 2 (e.g. Nf) of the 29 family of phages infect the spore forming bacterium Bacillus subtilis. Although classified as lytic phages, the lytic cycle of 29 can be suppressed and its genome can become entrapped into the B. subtilis spore. This constitutes an alternative infection strategy that depends on the presence of binding sites for the host-encoded protein Spo0A in the 29 genome. Binding of Spo0A to these sites represses 29 transcription and prevents initiation of DNA replication. Although the Nf genome can also become trapped into B. subtilis spores, in vivo studies showed that its lytic cycle is less susceptible to spo0A-mediated suppression than that of 29. Here we have analysed the molecular mechanism underlying this difference showing that Spo0A differently affects transcription and replication initiation of the genomes of these phages. Thus, whereas Spo0A represses all three main early promoters of 29, it only represses one out of the three equivalent early promoters of Nf. In addition, contrary to 29, Spo0A does not prevent the in vitro initiation of Nf DNA replication. Altogether, the differences in Spo0A-mediated regulation of transcription and replication between 29 and Nf explain their different behaviours in vivo.


Figures

Figure 1.
Figure 1.
Genetic and transcriptional maps of the Nf and ϕ29 genomes. Small vertical lines in the phage genomes indicate gene boundaries. The direction of transcription and length of the transcripts are indicated by arrows. Early (A2c, A2b and C2) and late (A3) promoters are encircled. The bidirectional transcriptional terminator TD1 is indicated by a hairpin structure. Black circles represent the TP covalently linked at the 5′ DNA ends. The positions of the parS sites are indicated with vertical arrowheads. Blow-ups of the A2c–A3 and C2-promoter regions are shown in between the maps of ϕ29 and Nf. Features for Nf and ϕ29 in the promoter regions are located above and below the line representing DNA, respectively. The −35 and −10 boxes are indicated with black boxes. Note that the late A3 promoter lacks a typical −35 sequence. Transcription start sites are indicated with bent arrows. The positions of the consensus 0A box sequences (5′-TGTCGAA-3′) are indicated with horizontal arrowheads and those of the main protein p4-binding sites with grey boxes. The position of the imperfect Nf 0A-box 1′ is indicated with a striped arrowhead.
Figure 2.
Figure 2.
Effect of Spo0A on the in vitro transcription of the main early and late promoters of Nf. Promoter A2c (A), C2 (B), A2b (C), A3 (D). Reaction mixtures contained 4 nM of the appropriate template DNA containing the indicated promoter, 40 nM of purified B. subtilis RNAP and increasing amounts of Spo0A. Spo0A concentrations, in 4-fold dilution steps, ranged from 23 nM to 23.6 μM. In the case of the late A3 promoter, the reaction mixture also contained 2.3 μM of protein p4.
Figure 3.
Figure 3.
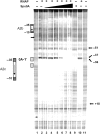
Footprint analysis of protein Spo0A binding the Nf early A2c (A) and A2b–A3 (B) promoter region. DNA fragments, labelled at the 5′ end of the template strand for early transcription, were incubated with increasing amounts of Spo0A as indicated above the footprints. The numbering used in panels A and B is according to the transcriptional start sites of promoters A2c and A2b, respectively. The −10 and −35 promoter regions are indicated with striped boxes. The DNA region protected upon Spo0A binding is indicated at the right. Spo0A concentrations, in 4-fold dilutions steps, ranged from 29 nM to 29.7 μM (A) and from 29 nM to 7.4 μM (B).
Figure 4.
Figure 4.
Footprint analysis of RNAP binding to the Nf early A2c promoter in the absence or presence of Spo0A. A DNA fragment containing the A2c-promoter region, labelled at the 5′ end at the template strand for early transcription, was incubated with the proteins as indicated above the footprints. The numbering used is according to the transcriptional start site of promoter A2c. The promoter and its directionality are indicated at the left; the striped boxes depict the −10 and −35 boxes. The positions of the two imperfect 0A boxes are indicated with dotted rectangles. When indicated, 70 nM of RNAP was added 10 min after Spo0A addition. Spo0A concentrations ranged from 29 nM to 29.7 μM (4-fold dilution steps). The Spo0A concentration used in lane 9 was 7.4 μM.
Figure 5.
Figure 5.
Binding of Spo0A to the 0A box 3′ region prevents p4-mediated recruitment of RNAP to the Nf late A3 promoter. The DNA fragment used, end-labelled at the template strand, includes the A3 promoter and the upstream 0A box 3′, p4-binding site 3, as well as the early A2b promoter. The numbering used is relative to the promoter A3 transcription start site. The positions that become hypersensitive to DNase I in the presence of protein p4 are indicated with black arrows. The position of the p4-binding site 3 is indicated with a dotted rectangle. The promoters and their directionality are indicated at the left; striped boxes depict the −10 and −35 boxes. 0A box 3′ region is indicated with a black bar. Fixed amounts of RNAP (70 nM) and p4 (2.3 μM) were used. Spo0A concentrations, 4-fold dilution steps, ranged from 464 nM to 29.7 μM (lanes 2–5), 116 nM to 29.7 μM (lanes 8–12) and 29 nM to 29.7 μM (lanes 16–21). The Spo0A concentration used in lane 22 was 29.7 μM.
Figure 6.
Figure 6.
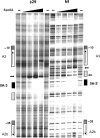
Comparative analysis of Spo0A binding to the equivalent 0A box 3 region in the ϕ29 and Nf genomes. The DNA fragments used include: the late A3 promoter, 0A box 3/0A box 3′, p4-binding site 3 and the early A2b promoter of each phage genome. The fragments were labelled at the 5′ of the late strand at exactly the same distance from 0A-3 and 0A-3′. The black arrows indicate hypersensitive sites generated upon Spo0A binding. The black boxes indicate the position of the perfect 0A box 3 and 0A box 3′, and the imperfect flanking 0A boxes are indicated with dotted boxes. The promoters and their directionality are indicated; the striped boxes depict the −10 and −35 boxes. Spo0A concentrations, 4-fold dilution steps, ranged from 116 nM to 7.4 μM.
Figure 7.
Figure 7.
Spo0A hardly prevents formation of p6-nucleoprotein initiation complexes at the Nf origins of replication. Binding of Spo0A without (lanes 6–10) or with (lanes 12–17) the initiator protein p6 to the right Nf origin of replication was analysed by DNase I footprinting. The DNA fragment corresponding to the right DNA end of Nf, labelled at their 5′ end, was incubated with the proteins as shown above the footprint. When indicated, 16 μM of initiator protein p6 was added 10 min after Spo0A addition. Spo0A concentration used, 4-fold dilution steps, ranged from 464 nM to 29.7 μM (lanes 2–5), 116 nM to 29.7 μM (lanes 6–10) and 29 nM to 29.7 μM (lanes 12–17). Spo0A concentration used in lane 18 was 29.7 μM. Protein p6-induced hypersensitive sites are indicated with black arrows. Binding of Spo0A close to the DNA end is indicated with a black bar. The top of the footprint corresponds to the end of Nf DNA.
Figure 8.
Figure 8.
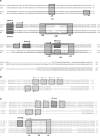
Sequence alignments of the A2b-A3 promoter region (A), of the left origins (B) and of the right origins (C) of the genomes of some group 1 (ϕ29, ϕ15, PZA and BS32) and group 2 (Nf, B103 and M2Y) members of the ϕ29-family of phages. The perfect and imperfect 0A boxes are indicated with dark and light grey rectangles, respectively. The directionality of the 0A boxes is indicated with arrows. The nucleotides that deviate from the consensus Spo0A-binding site are indicated with lower case letters. The striped boxes depict the −10 and −35 promoter elements. The different accession numbers of the sequences used are the same as in Pecénkova and Paces (33). The Clustal W program (www.ebi.ac.uk/Tools/clustalw2/index.html) was used for aligning the DNA sequences.

Similar articles

Cited by

References

    1. Hoch JA. Regulation of the phosphorelay and the initiation of sporulation in Bacillus subtilis. Annu. Rev. Microbiol. 1993;47:441–465. - PubMed
    1. Piggot PJ, Losick R. Sporulation genes and intercompartmental regulation. In: Sonenshein AL, Hoch JA, Losick R, editors. Bacillus Subtilis and its Closest Relatives: From Genes to Cells. Washington, DC: American Society for Microbiology press; 2002. pp. 483–517.
    1. Errington J. Regulation of endospore formation in Bacillus subtilis. Nat. Rev. Microbiol. 2003;1:117–126. - PubMed
    1. Lewis RJ, Scott DJ, Brannigan JA, Ladds JC, Cervin MA, Spiegelman GB, Hogget JG, Barák I, Wilkinson AJ. Dimer formation and transcription activation in the sporulation response regulator Spo0A. J. Mol. Biol. 2002;316:235–245. - PubMed
    1. Muchová K, Lewis RJ, Perecko D, Brannigan JA, Ladds JC, Leech A, Wilkinson AJ, Barák I. Dimer-induced signal propagation in Spo0A. Mol. Microbiol. 2004;53:829–842. - PubMed

Publication types

MeSH terms