

Overestimation of alternative splicing caused by variable probe characteristics in exon arrays
- PMID: 19528075
- PMCID: PMC2760813
- DOI: 10.1093/nar/gkp508
Overestimation of alternative splicing caused by variable probe characteristics in exon arrays
Abstract
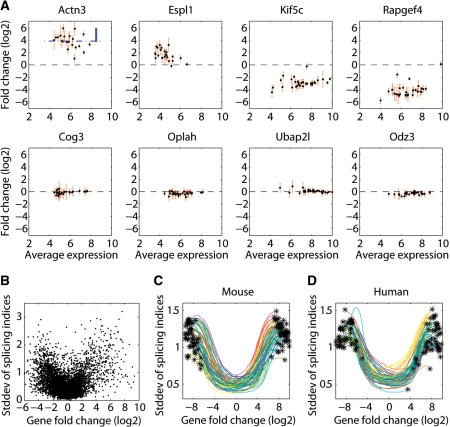
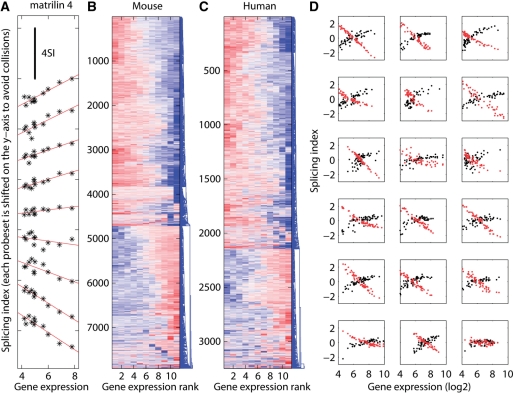
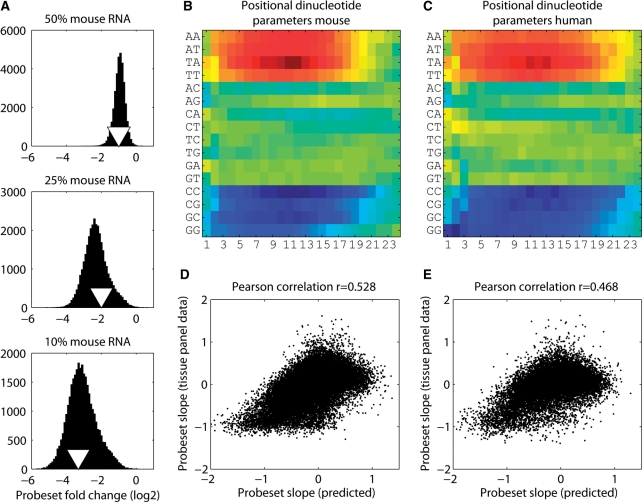
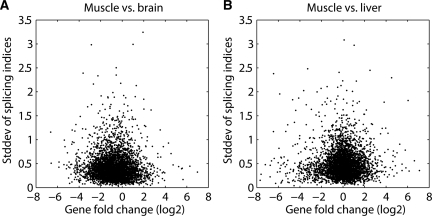
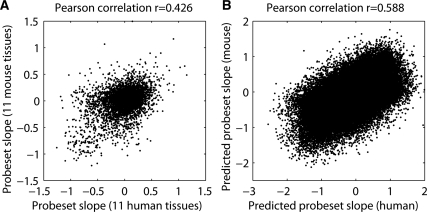
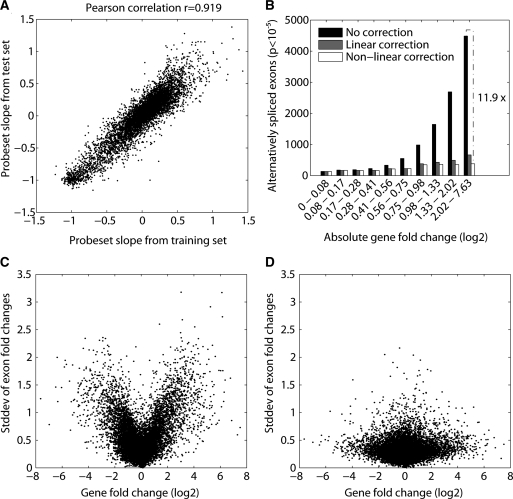
In higher eukaryotes, alternative splicing is a common mechanism for increasing transcriptome diversity. Affymetrix exon arrays were designed as a tool for monitoring the relative expression levels of hundreds of thousands of known and predicted exons with a view to detecting alternative splicing events. In this article, we have analyzed exon array data from many different human and mouse tissues and have uncovered a systematic relationship between transcript-fold change and alternative splicing as reported by the splicing index. Evidence from dilution experiments and deep sequencing suggest that this effect is of technical rather than biological origin and that it is driven by sequence features of the probes. This effect is substantial and results in a 12-fold overestimation of alternative splicing events in genes that are differentially expressed. By cross-species exon array comparison, we could further show that the systematic bias persists even across species boundaries. Failure to consider this effect in data analysis would result in the reproducible false detection of apparently conserved alternative splicing events. Finally, we have developed a software in R called COSIE (Corrected Splicing Indices for Exon arrays) that for any given set of new exon array experiments corrects for the observed bias and improves the detection of alternative splicing (available at www.fmi.ch/groups/gbioinfo).
Figures
Similar articles
-
MADS+: discovery of differential splicing events from Affymetrix exon junction array data.Bioinformatics. 2010 Jan 15;26(2):268-9. doi: 10.1093/bioinformatics/btp643. Epub 2009 Nov 17. Bioinformatics. 2010. PMID: 19933160 Free PMC article.
-
Gene expression and isoform variation analysis using Affymetrix Exon Arrays.BMC Genomics. 2008 Nov 7;9:529. doi: 10.1186/1471-2164-9-529. BMC Genomics. 2008. PMID: 18990248 Free PMC article.
-
Comparison of Affymetrix Gene Array with the Exon Array shows potential application for detection of transcript isoform variation.BMC Genomics. 2009 Nov 12;10:519. doi: 10.1186/1471-2164-10-519. BMC Genomics. 2009. PMID: 19909511 Free PMC article.
-
Data analysis of alternative splicing microarrays.Drug Discov Today. 2006 Nov;11(21-22):983-90. doi: 10.1016/j.drudis.2006.09.011. Epub 2006 Sep 26. Drug Discov Today. 2006. PMID: 17055407 Review.
-
Microarray analysis of alternative splicing.OMICS. 2006 Fall;10(3):344-57. doi: 10.1089/omi.2006.10.344. OMICS. 2006. PMID: 17069512 Review.
Cited by
-
Transcriptional activity regulates alternative cleavage and polyadenylation.Mol Syst Biol. 2011 Sep 27;7:534. doi: 10.1038/msb.2011.69. Mol Syst Biol. 2011. PMID: 21952137 Free PMC article.
-
Cytokines interleukin-1beta and tumor necrosis factor-alpha regulate different transcriptional and alternative splicing networks in primary beta-cells.Diabetes. 2010 Feb;59(2):358-74. doi: 10.2337/db09-1159. Epub 2009 Nov 23. Diabetes. 2010. PMID: 19934004 Free PMC article.
-
Global regulation of alternative splicing by adenosine deaminase acting on RNA (ADAR).RNA. 2013 May;19(5):591-604. doi: 10.1261/rna.038042.112. Epub 2013 Mar 8. RNA. 2013. PMID: 23474544 Free PMC article.
-
Different effects of the probe summarization algorithms PLIER and RMA on high-level analysis of Affymetrix exon arrays.BMC Bioinformatics. 2010 Apr 28;11:211. doi: 10.1186/1471-2105-11-211. BMC Bioinformatics. 2010. PMID: 20426803 Free PMC article.
-
R and Bioconductor solutions for alternative splicing detection.Hum Genomics. 2009 Dec;4(2):131-5. doi: 10.1186/1479-7364-4-2-131. Hum Genomics. 2009. PMID: 20038500 Free PMC article.
References
-
- Clark TA, Sugnet CW, Ares M. Genomewide analysis of mRNA processing in yeast using splicing-specific microarrays. Science. 2002;296:907–910. - PubMed
-
- Cline MS, Blume J, Cawley S, Clark TA, Hu JS, Lu G, Salomonis N, Wang H, Williams A. ANOSVA: a statistical method for detecting splice variation from expression data. Bioinformatics. 2005;21(Suppl. 1):i107–i115. - PubMed
Publication types
MeSH terms
Substances
LinkOut - more resources
Full Text Sources
Molecular Biology Databases
