

Detection of single nucleotide variations in expressed exons of the human genome using RNA-Seq
- PMID: 19528076
- PMCID: PMC2760790
- DOI: 10.1093/nar/gkp507
Detection of single nucleotide variations in expressed exons of the human genome using RNA-Seq
Abstract
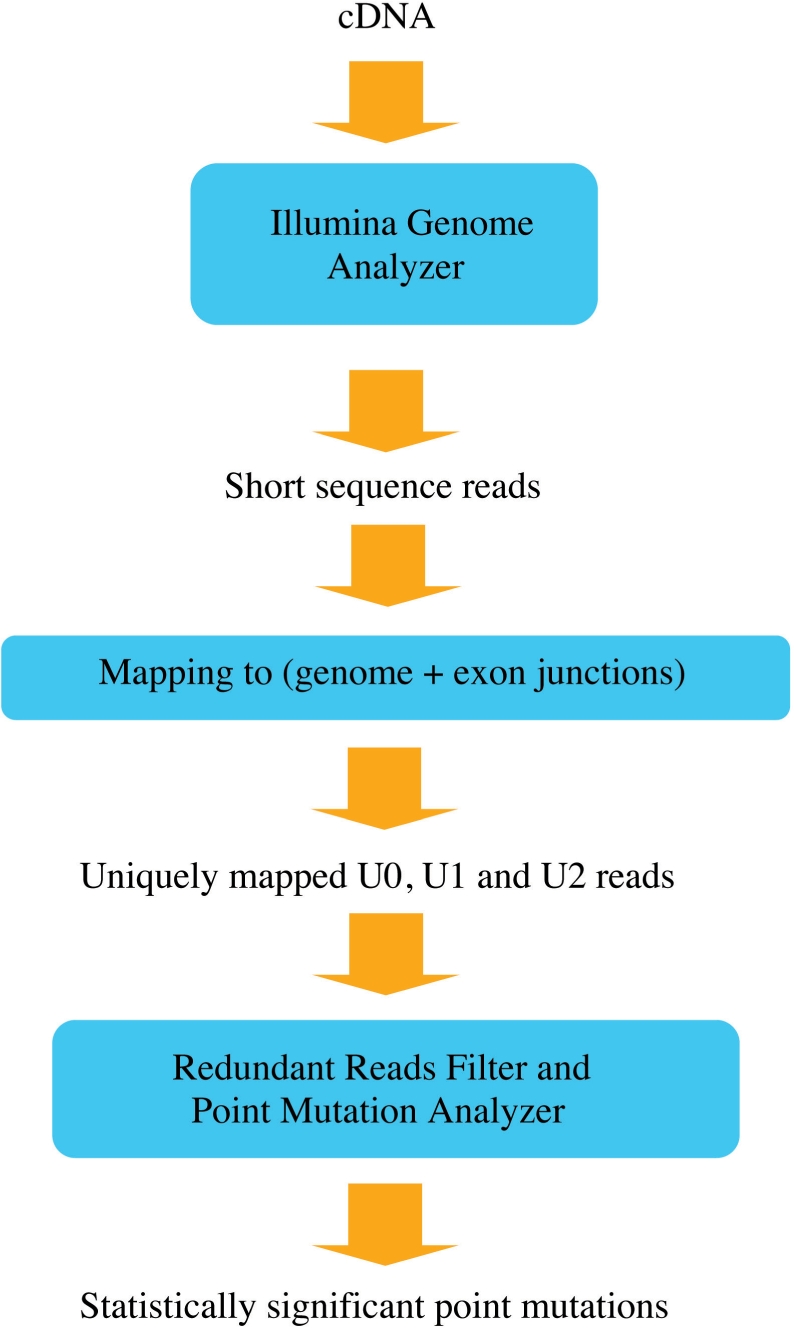
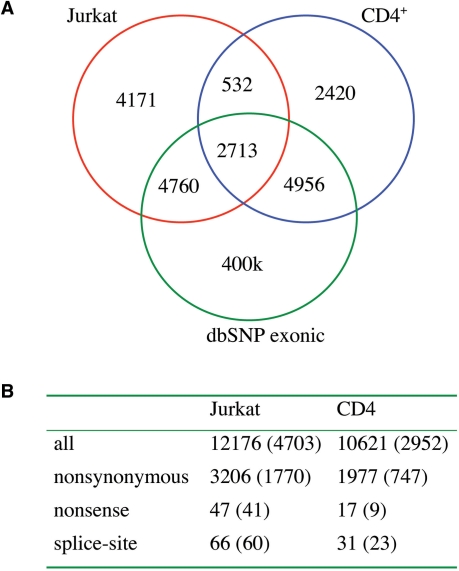
Whole-genome resequencing is still a costly method to detect genetic mutations that lead to altered forms of proteins and may be associated with disease development. Since the majority of disease-related single nucleotide variations (SNVs) are found in protein-coding regions, we propose to identify SNVs in expressed exons of the human genome using the recently developed RNA-Seq technique. We identify 12 176 and 10 621 SNVs, respectively, in Jurkat T cells and CD4(+) T cells from a healthy donor. Interestingly, our data show that one copy of the TAL-1 proto-oncogene has a point mutation in 3' UTR and only the mutant allele is expressed in Jurkat cells. We provide a comprehensive dataset for further understanding the cancer biology of Jurkat cells. Our results indicate that this is a cost-effective and efficient strategy to systematically identify SNVs in the expressed regions of the human genome.
Figures
Similar articles
-
Inconsistency and features of single nucleotide variants detected in whole exome sequencing versus transcriptome sequencing: A case study in lung cancer.Methods. 2015 Jul 15;83:118-27. doi: 10.1016/j.ymeth.2015.04.016. Epub 2015 Apr 23. Methods. 2015. PMID: 25913717 Free PMC article.
-
Multivariate models from RNA-Seq SNVs yield candidate molecular targets for biomarker discovery: SNV-DA.BMC Genomics. 2016 Mar 31;17:263. doi: 10.1186/s12864-016-2542-4. BMC Genomics. 2016. PMID: 27029813 Free PMC article.
-
Using RNA-Seq Data for the Detection of a Panel of Clinically Relevant Mutations.Stud Health Technol Inform. 2018;253:217-221. Stud Health Technol Inform. 2018. PMID: 30147077
-
Rules and tools to predict the splicing effects of exonic and intronic mutations.Wiley Interdiscip Rev RNA. 2018 Jan;9(1). doi: 10.1002/wrna.1451. Epub 2017 Sep 26. Wiley Interdiscip Rev RNA. 2018. PMID: 28949076 Review.
-
[Whole-genome sequencing and its application in the research and diagnoses of genetic diseases].Yi Chuan. 2014 Nov;36(11):1087-98. Yi Chuan. 2014. PMID: 25567867 Review. Chinese.
Cited by
-
Inconsistency and features of single nucleotide variants detected in whole exome sequencing versus transcriptome sequencing: A case study in lung cancer.Methods. 2015 Jul 15;83:118-27. doi: 10.1016/j.ymeth.2015.04.016. Epub 2015 Apr 23. Methods. 2015. PMID: 25913717 Free PMC article.
-
Whole transcriptome analyses of six thoroughbred horses before and after exercise using RNA-Seq.BMC Genomics. 2012 Sep 12;13:473. doi: 10.1186/1471-2164-13-473. BMC Genomics. 2012. PMID: 22971240 Free PMC article.
-
Development of Transcriptomic Markers for Population Analysis Using Restriction Site Associated RNA Sequencing (RARseq).PLoS One. 2015 Aug 4;10(8):e0134855. doi: 10.1371/journal.pone.0134855. eCollection 2015. PLoS One. 2015. PMID: 26241739 Free PMC article.
-
Transcriptome analysis in switchgrass discloses ecotype difference in photosynthetic efficiency.BMC Genomics. 2016 Dec 16;17(1):1040. doi: 10.1186/s12864-016-3377-8. BMC Genomics. 2016. PMID: 27986076 Free PMC article.
-
Statistical design and analysis of RNA sequencing data.Genetics. 2010 Jun;185(2):405-16. doi: 10.1534/genetics.110.114983. Epub 2010 May 3. Genetics. 2010. PMID: 20439781 Free PMC article.
References
-
- Stenson PD, Ball EV, Mort M, Phillips AD, Shiel JA, Thomas NS, Abeysinghe S, Krawczak M, Cooper DN. Human Gene Mutation Database (HGMD): 2003 update. Hum. Mutat. 2003;21:577–581. - PubMed
-
- Mortazavi A, Williams BA, McCue K, Schaeffer L, Wold B. Mapping and quantifying mammalian transcriptomes by RNA-Seq. Nat. Methods. 2008;5:621–628. - PubMed
-
- Sultan M, Schulz MH, Richard H, Magen A, Klingenhoff A, Scherf M, Seifert M, Borodina T, Soldatov A, Parkhomchuk D, et al. A global view of gene activity and alternative splicing by deep sequencing of the human transcriptome. Science. 2008;321:956–960. - PubMed
Publication types
MeSH terms
Substances
Grants and funding
LinkOut - more resources
Full Text Sources
Other Literature Sources
Molecular Biology Databases
Research Materials
Miscellaneous
