. 2009 Aug;29(16):4527-38.
doi: 10.1128/MCB.00200-09. Epub 2009 Jun 15.

Hypoxia-inducible factor 2 regulates hepatic lipid metabolism

Affiliations

Hypoxia-inducible factor 2 regulates hepatic lipid metabolism

Erinn B Rankin et al. Mol Cell Biol. 2009 Aug.

Abstract

In mammals, the liver integrates nutrient uptake and delivery of carbohydrates and lipids to peripheral tissues to control overall energy balance. Hepatocytes maintain metabolic homeostasis by coordinating gene expression programs in response to dietary and systemic signals. Hepatic tissue oxygenation is an important systemic signal that contributes to normal hepatocyte function as well as disease. Hypoxia-inducible factors 1 and 2 (HIF-1 and HIF-2, respectively) are oxygen-sensitive heterodimeric transcription factors, which act as key mediators of cellular adaptation to low oxygen. Previously, we have shown that HIF-2 plays an important role in both physiologic and pathophysiologic processes in the liver. HIF-2 is essential for normal fetal EPO production and erythropoiesis, while constitutive HIF-2 activity in the adult results in polycythemia and vascular tumorigenesis. Here we report a novel role for HIF-2 in regulating hepatic lipid metabolism. We found that constitutive activation of HIF-2 in the adult results in the development of severe hepatic steatosis associated with impaired fatty acid beta-oxidation, decreased lipogenic gene expression, and increased lipid storage capacity. These findings demonstrate that HIF-2 functions as an important regulator of hepatic lipid metabolism and identify HIF-2 as a potential target for the treatment of fatty liver disease.


Figures

FIG. 1.
FIG. 1.
Inactivation of Hif-2α suppresses the development of hepatic steatosis in albumin-Vhlh mutant mice. (A) Photograph of 4-week-old control (Cre) and albumin-Vhlh mutant mice. (B) Average body weights of albumin-Vhlh, -Vhlh/Hif-1α, -Vhlh/Hif-2α, -Vhlh/Hif-1α/Hif-2α, and control (Cre) mice. (C) Percent liver weight to body weight in albumin-Cre mutant mice. For panels B and C, asterisks indicate a significant difference in body weight or in liver-to-body weight ratio from that of control (Cre) mice (**, P < 0.001) as determined by the Student t test. (D) Macroscopic and histological analysis of albumin-Cre mutant livers. Note the pale color of the albumin-Vhlh and -Vhlh/Hif-1α mutant livers (top row). Bars, 7 mm. Hematoxylin and eosin (H&E) and Oil Red O staining show neutral lipid accumulation in large macrovesicular lipid droplets found in albumin-Vhlh- and -Vhlh/Hif-1α-deficient livers.
FIG. 2.
FIG. 2.
Hierarchical cluster analysis of Hif-2-dependent metabolic gene expression in the liver. Shown are differentially regulated genes that were upregulated or downregulated 1.5-fold or greater in albumin-Vhlh mutant mouse livers in a Hif-1 (A)- or a Hif-2 (B and C)-dependent manner. Genes@Work (IBM) was used to generate a heat map depicting gene expression levels in albumin-Vhlh/Hif-1α/Hif-2α (group C, n = 4; triple mutant with absent Hif signaling), -Vhlh/Hif-2α (group B, n = 4; double mutant with active Hif-1), and -Vhlh/Hif-1α (group A, n = 3; double mutant with active Hif-2) mutant mouse livers compared to a common reference RNA sample. Red and green boxes represent an increase or decrease in expression, respectively. Each column represents expression levels in an individual liver sample. Genes were clustered using Euclidean average linkage clustering.
FIG. 3.
FIG. 3.
Srebp-1c and lipogenic gene expression is suppressed in albumin-Vhlh mutant mouse livers. (A) List of genes in the Srebp-1c signaling pathway that are differentially expressed between albumin-Vhlh/Hif-1α and -Vhlh/Hif-1α/Hif-2α mutant mouse livers determined by microarray analysis. Microarray results were confirmed by real-time PCR analysis where indicated. N/D, not determined. (B) Real-time PCR analysis of Fasn expression in albumin-Cre mutant mouse livers. Relative expression levels were normalized to 18S. Error bars represent the standard errors of the means (n = 4). Asterisks indicate a statistically significant decrease in Fasn expression compared to control mice as determined by the Student t test (*, P < 0.05). (C) Western blot analysis of acetyl-CoA carboxylase (ACC) and phosphorylated ACC (ACC-P) protein levels in albumin-Cre mutant mouse cytoplasmic liver extracts. Actin was used as a protein loading control.
FIG. 4.
FIG. 4.
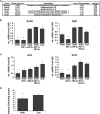
Inactivation of Hif-2α restores fatty acid β-oxidation gene expression in albumin-Vhlh mutant mouse livers. (A) List of PPARα target genes that are differentially expressed between albumin-Vhlh/Hif-1α and -Vhlh/Hif-1α/Hif-2α mutant mouse livers as determined by microarray analysis. Microarray results were confirmed by real-time PCR analysis where indicated. (B and C) Quantitative real-time PCR analysis of PPARα target genes and key enzymes involved in mitochondrial (B) and peroxisomal (C) β-oxidation. Shown are average mRNA transcript levels for each genotype; error bars represent standard errors of the means (n = 4). Asterisks indicate a statistically significant difference in gene expression compared to control mice (Cre) as determined by the Student t test (*, P < 0.05; **, P < 0.001). Abbreviations: Acsl1, acyl-CoA synthase long-chain family member 1; Cpt1, carnitine-palmitoyltransferase I; Aco, acyl-CoA oxidase; Crot, carnitine O-octanoyltransferase. (D) State 3 oxygen consumption rates for palmitoylcarnitine in isolated mitochondria from albumin-Vhlh (Vhlh) and control (Cre) mutant mouse livers. For panels B to D, asterisks indicate a statistically significant decrease in oxygen consumption compared to control mice (Cre) as determined by the Student t test (*, P < 0.05). Error bars represent standard errors of the means (n = 5).
FIG. 5.
FIG. 5.
Inactivation of Hif-2α restores gluconeogenic gene expression in albumin-Vhlh mutant mouse livers. Relative expression levels of gluconeogenic genes in the livers of 4-week-old albumin-Cre mutant mice determined by real-time PCR. Expression levels were normalized to 18S. Shown are the average mRNA expression levels for each genotype; error bars represent standard errors of the means (n = 4). Asterisks indicate a statistically significant change in gene expression compared to control as determined by the Student t test (*, P < 0.05; **, P < 0.001).
FIG. 6.
FIG. 6.
Adfp is preferentially regulated by Hif-2α in hepatocytes. (A) Real-time PCR analysis of Adfp expression in albumin-Cre mutant mouse livers. Expression levels were normalized to 18S. Shown are the average mRNA expression levels for the indicated genotypes; error bars represent standard errors of the means (n = 3). Asterisks indicate a statistically significant change in gene expression compared to control as determined by the Student t test (*, P < 0.05). (B) Western blot analysis of Adfp expression in albumin-Cre mutants. Cytoplasmic protein extracts were used for analysis. Actin served as a loading control. (C) Immunofluorescent staining for Adfp (red) in albumin-Cre mutant mouse liver sections counterstained with 4′,6-diamidino-2-phenylindole (blue nuclei). (D) Hematoxylin and eosin (top) and immunofluorescent (bottom) staining for Adfp (green) and Nile red (red) in PEPCK-Vhlh mutant mouse liver sections. Arrows point to areas of hepatic steatosis. (E) Real-time PCR analysis of ADFP expression in normoxic (N) and hypoxic (H; 16 h, 1% O2) HepG2 cells treated with control, HIF-1α, HIF-2α, or ARNT siRNA oligonucleotides. (F) Real-time PCR analysis of lipid droplet binding protein expression in albumin-Cre mutant mouse livers (top) and HepG2 cells exposed to 21% or 1% oxygen for 16 h (bottom). Expression levels were normalized to 18S. Bars represent the mean mRNA expression levels of four samples per group; error bars represent standard errors of the means. Asterisks indicate a statistically significant change in gene expression compared to control as determined by the Student t test (*, P < 0.05).
FIG. 7.
FIG. 7.
Model depicting the roles of HIF-1 and HIF-2 in the regulation of hepatic glucose and lipid metabolism. Cells adapt metabolically to hypoxia by switching from aerobic to anaerobic metabolism in order to generate ATP in an oxygen-independent manner. While HIF-1 regulates glycolysis and pyruvate metabolism, HIF-2 controls fatty acid metabolism. Together, HIF-1 and HIF-2 cooperate in the reprogramming of metabolic pathways to generate cellular energy when oxidative phosphorylation is impaired due to decreased availability of molecular oxygen. Red lines indicate inhibitory effects of HIF activation; stimulatory effects of HIF activation are indicated by green arrows.

References

    1. Bruder, E. D., P. C. Lee, and H. Raff. 2005. Lipid and fatty acid profiles in the brain, liver, and stomach contents of neonatal rats: effects of hypoxia. Am. J. Physiol. Endocrinol. Metab. 288E314-E320. - PubMed
    1. Brunt, E. M., B. A. Neuschwander-Tetri, D. Oliver, K. R. Wehmeier, and B. R. Bacon. 2004. Nonalcoholic steatohepatitis: histologic features and clinical correlations with 30 blinded biopsy specimens. Hum. Pathol. 351070-1082. - PubMed
    1. Chakravarthy, M. V., Z. Pan, Y. Zhu, K. Tordjman, J. G. Schneider, T. Coleman, J. Turk, and C. F. Semenkovich. 2005. “New” hepatic fat activates PPARalpha to maintain glucose, lipid, and cholesterol homeostasis. Cell Metab. 1309-322. - PubMed
    1. Chang, B. H., L. Li, A. Paul, S. Taniguchi, V. Nannegari, W. C. Heird, and L. Chan. 2006. Protection against fatty liver but normal adipogenesis in mice lacking adipose differentiation-related protein. Mol. Cell. Biol. 261063-1076. - PMC - PubMed
    1. Das, D. K., J. Ayromlooi, and A. Neogi. 1983. Effect of ischemia on fatty acid metabolism in fetal lung. Life Sci. 33569-576. - PubMed

Publication types

MeSH terms

Substances

LinkOut - more resources