. 2009 Jun 15;185(6):1047-63.
doi: 10.1083/jcb.200811099.

Formation of cristae and crista junctions in mitochondria depends on antagonism between Fcj1 and Su e/g

Affiliations

Formation of cristae and crista junctions in mitochondria depends on antagonism between Fcj1 and Su e/g

Regina Rabl et al. J Cell Biol. .

Abstract

Crista junctions (CJs) are important for mitochondrial organization and function, but the molecular basis of their formation and architecture is obscure. We have identified and characterized a mitochondrial membrane protein in yeast, Fcj1 (formation of CJ protein 1), which is specifically enriched in CJs. Cells lacking Fcj1 lack CJs, exhibit concentric stacks of inner membrane in the mitochondrial matrix, and show increased levels of F(1)F(O)-ATP synthase (F(1)F(O)) supercomplexes. Overexpression of Fcj1 leads to increased CJ formation, branching of cristae, enlargement of CJ diameter, and reduced levels of F(1)F(O) supercomplexes. Impairment of F(1)F(O) oligomer formation by deletion of its subunits e/g (Su e/g) causes CJ diameter enlargement and reduction of cristae tip numbers and promotes cristae branching. Fcj1 and Su e/g genetically interact. We propose a model in which the antagonism between Fcj1 and Su e/g locally modulates the F(1)F(O) oligomeric state, thereby controlling membrane curvature of cristae to generate CJs and cristae tips.


Figures

Figure 1.
Figure 1.
Fcj1 is required for normal mitochondrial morphology. (A) Wild-type (WT) and Δfcj1 cells expressing mitochondria-targeted GFP were grown on nonfermentable medium and visualized by fluorescence microscopy. (B) Domain structure of Fcj1 depicting the mitochondrial-targeting sequence (MTS), the transmembrane segment (TM), the coiled-coiled domain, and the conserved C-terminal domain (CTD) with corresponding positions of amino acid residues. (C) Subcellular fractionation of wild-type cells: mitochondria (Mito), microsomes (ER), and cytosol. Equal amounts of protein (50 µg) were analyzed by Western blotting with the indicated marker proteins: Tim44 (Mito), Erp1 (ER), and Hxk1 (Cytosol). (D) Submitochondrial localization of Fcj1. Wild-type mitochondria and mitoplasts generated by hypotonic swelling (SW) were treated with PK. f, specific proteolytic fragment of Oxa1. (E) Membrane association of Fcj1. Wild-type mitochondria were extracted with NaCl or Na carbonate. Membrane-bound (P) and soluble (S) fractions were loaded and analyzed by Western blotting using the indicated marker proteins. DLD, d-lactate dehydrogenase. (F) Homotypic interaction of Fcj1. Mitochondria from cells expressing a His-tagged (Fcj1-His6) or a TAP-tagged variant of Fcj1 (Fcj1-TAP) or both were subjected to TAP affinity chromatography. Total (T; 10%), bound (B; 100%), and unbound (UB; 10%) material was analyzed by Western blotting with the indicated antibodies. Tom40 and TAP-tagged Fcj1 were detected simultaneously using rabbit antibodies against Tom40. Bars, 1 µm.
Figure 2.
Figure 2.
Fcj1 is enriched at CJs. (A) Immunogold labeling of Fcj1 in wild-type cells. (B) Representation of gold particles after immunogold labeling of Fcj1 plotted on a model of CM, IBM, and OM (Vogel et al., 2006). (C and D) Quantification of protein densities in the IM. The number of gold particles occurring within a 14-nm distance from the IM was determined by moving a sliding window in silico along the IM in the model from bottom to top (raw data from C and from Vogel et al. [2006]). Gray boxes indicate the CJ region. The protein densities of Fcj1 and Cox2 (C) and of Su g and Su e (D) are shown. Bars, 100 nm.
Figure 3.
Figure 3.
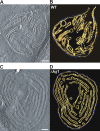
Cristae morphology is altered, and CJs are absent in cells lacking Fcj1. (A–D) EM tomograms of chemically fixed yeast cells. (A) Single slice of a tomogram of a mitochondrion in a wild-type cell. (B) Surface-rendered view of A. (C) Single slice of a tomogram of a mitochondrion from a Δfcj1 cell. (D) Surface-rendered view of C. The OM (blue) and IM (yellow) are shown. WT, wild type. Bars, 100 nm.
Figure 4.
Figure 4.
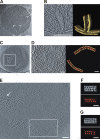
Δfcj1 mitochondria contain zipperlike structures typical of oligomers of the F1FO–ATP synthase. Cryo-EM tomograms of isolated mitochondria. (A) Slice through a tomogram of a vitrified wild-type mitochondrion. (B) A CJ magnified (left) and surface rendered (right) corresponding to the boxed area in A is shown. Panels A and B are reprinted from Zick et al. (2009) with permission from Biochimica et Biophysica Acta. (C–G) Δfcj1 mitochondria. (C) Slice through a tomogram of a vitrified Δfcj1 mitochondrion. (D) Magnified view of boxed area in C (left) and surface-rendered representation (right) showing a zipperlike, regular arrangement with characteristics of the F1 parts of F1FO–ATP synthase. The IM is shown in yellow, and F1FO–ATP synthases are shown in red. (E) A 10-nm thick slice of a tomogram cutting through particles typical of the F1 parts of F1FO–ATP synthase in side views (arrow) and top views (boxed area). (F and G) Sections through the tomogram and volume-rendered top views of putative F1FO–ATP synthases arranged in double-row hexagonal stripes (F) and double-row square stripes (G) are shown. Bars: (A–C and E) 100 nm; (D, F, and G) 50 nm.
Figure 5.
Figure 5.
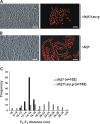
Zipperlike structures observed in Δfcj1 mitochondria depend on the presence of dimer-specific Su e and Su g of F1FO–ATP synthase. Cryo-EM tomograms of isolated mitochondria of indicated strains. (A) Top views of putative F1FO–ATP synthases in Δfcj1/Δsu g mitochondria (left) and a surface-rendered representation (right) are shown. (B) Top views of putative F1FO–ATP synthases in Δfcj1 mitochondria (left; magnified view of boxed area in Fig. 4 E) and a surface-rendered representation (right) are shown. (C) Frequency distribution of F1–F1 distances. The center to center distance of an F1 particle to its nearest neighbor was determined for cryo-EM tomograms of isolated mitochondria of the indicated strains (n = 102 for both strains). Bars, 50 nm.
Figure 6.
Figure 6.
Fcj1 is directly involved in determining the number and the architecture of CJs. (A) Electron micrograph of a mitochondrion in a section of chemically fixed cells overexpressing Fcj1. (B) Distribution of diameters of CJs in wild-type (WT) control strain (W303) containing empty pCM189 plasmid (n = 21) and Fcj1-overexpressing strain (W303) containing pCM189-Fcj1 plasmid (Fcj1↑; n = 40). Cells were grown on nonfermentable, selective minimal media. A histogram of the number of diameters within the indicated ranges was plotted for both strains. (C and D) Fcj1 was down-regulated in a Δfcj1 strain harboring the pCM189-Fcj1 at different times after doxycycline addition. Wild-type control as in B was used. (C) Expression levels of Fcj1 were monitored by Western blot analysis. (D) Phenotypic analysis of down-regulation of Fcj1. The number of CJs and branches per mitochondrial section (m0 h = 26; m13.5 h = 69; m23 h = 49; m37.5 h = 66; m47.5 h = 57) was determined from electron micrographs of chemically fixed whole cells after the indicated time periods of down-regulation (m = number of mitochondrial sections). The number of CJs and cristae branches per mitochondrial section before down-regulation of Fcj1 (0 h) was defined as 100%. The number of rho0/rho cells and of cells containing cristae stacks is related to the number of total cells at each time point.
Figure 7.
Figure 7.
Fcj1 reduces the stability of F1FO–ATP synthase oligomers. (A) Protein levels in wild-type (WT), Δfcj1, Δsu e, and Δsu g mitochondria. Aliquots were subjected to SDS-PAGE and decorated with the indicated antibodies. (B) Solubility of F1FO–ATP synthase in detergents. Isolated mitochondria of Fcj1-overexpressing (Fcj1↑), wild-type, and Δfcj1 strains were solubilized in digitonin and centrifuged to obtain supernatant (S1) and pellet (P1) fractions. Nonsolubilized material (P1) was treated with Triton X-100 and centrifuged to obtain supernatant (S2) and pellet (P2) fractions. Aliquots were analyzed by Western blotting with the indicated antibodies. (C) BN-PAGE analysis. Wild-type, Δfcj1, and Fcj1-overexpressing mitochondria (400 µg) were solubilized at the indicated ratios of digitonin/protein (Dig/Prot; wt/wt) and subjected to BN-PAGE and to analysis in-gel of F1FO–ATPase activity. All lanes were originated from a single gel at identical image settings, but lanes 8 and 9 were cut and pasted in the appropriate order for clarity. (D) SEC. Wild-type, Δfcj1, and Fcj1-overexpressing mitochondria were solubilized at a digitonin/protein ratio of 1 (wt/wt) and fractionated by Superose 6 gel filtration chromatography, and aliquots were analyzed by Western blotting. The oligomeric forms of the F1FO–ATP synthase (O, oligomers; T, tetramers; D, dimers; M, monomers) are indicated as size markers.
Figure 8.
Figure 8.
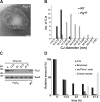
Functional link between Fcj1 and the F1FO–ATP synthase. (A and B) Genetic interaction of Fcj1 with Su e and Su g. (A) Generation times of the indicated strains (BY4742) grown in complete liquid lactate media during exponential growth at 30°C (n = 4). Error bars show standard deviations. Statistically significant differences (*, P < 0.05) according to a t test are indicated. (B) Growth of indicated strains tested by drop dilution in 1:10 steps on fermentable (yeast peptone dextrose [YPD]) and respiratory (lactate medium [YLac]) carbon sources. (C and D) Electron micrographs of mitochondria of chemically fixed Δsu g (C) and Δsu e (D) cells. Branches are indicated by arrows. Enlargement of the indicated box is shown as an inset in C. (E) Diameters of CJs in electron micrographs of mitochondrial sections of wild-type (WT; m = 40) and Δsu e strains (m = 40; m = number of mitochondrial sections). Histograms of the number of observed diameters within the indicated ranges are shown. Bars, 100 nm.
Figure 9.
Figure 9.
Working model of the formation of cristae and CJs in mitochondria. (A) Schematic representation of membrane curvatures at distinct regions of the CM and of the submitochondrial localization of Fcj1 and Su e and Su g in wild-type mitochondria. Positive membrane curvature is indicated in blue, negative curvature in red, and regions with both or no apparent curvature are colored in purple. An overview of a representative cristae sheet with one CJ is shown in side view (left) or as a cross section after 90° rotation (middle). Enlargements of boxed areas in 3D view show the proposed arrangement of Fcj1, Su e/Su g, and of F1FO in the respective regions of the CM and their influence on membrane curvature. (B) Schematic representation of membrane curvature in CM structures observed in the indicated mutant mitochondria. Upon depletion of Fcj1, positive curvatures of the CM are predominating, whereas membrane structures that require negative bending of the membrane are absent. The lack of Su e/Su g leads to an apparent reduction in positive membrane curvatures, which results in an enlargement of CJ diameter, branching of cristae, and a strong reduction in the number of apparent cristae tips. Increased levels of Fcj1 produce a similar phenotype. However, the formation of cristae tips is not affected in this mutant. ICS, intracristal space; M, matrix space.

References

    1. Al-Amoudi A., Chang J.J., Leforestier A., McDowall A., Salamin L.M., Norlen L.P., Richter K., Blanc N.S., Studer D., Dubochet J. 2004. Cryo-electron microscopy of vitreous sections.EMBO J. 23:3583–3588 - PMC - PubMed
    1. Allen R.D., Schroeder C.C., Fok A.K. 1989. An investigation of mitochondrial inner membranes by rapid-freeze deep-etch techniques.J. Cell Biol. 108:2233–2240 - PMC - PubMed
    1. Arnold I., Pfeiffer K., Neupert W., Stuart R.A., Schagger H. 1998. Yeast mitochondrial F1F0-ATP synthase exists as a dimer: identification of three dimer-specific subunits.EMBO J. 17:7170–7178 - PMC - PubMed
    1. Bornhövd C., Vogel F., Neupert W., Reichert A.S. 2006. Mitochondrial membrane potential is dependent on the oligomeric state of F1F0-ATP synthase supracomplexes.J. Biol. Chem. 281:13990–13998 - PubMed
    1. Buzhynskyy N., Sens P., Prima V., Sturgis J.N., Scheuring S. 2007. Rows of ATP synthase dimers in native mitochondrial inner membranes.Biophys. J. 93:2870–2876 - PMC - PubMed

Publication types

MeSH terms

Substances