. 2009 Jun 15;23(12):1408-22.
doi: 10.1101/gad.1777309.

The rate of cell growth is governed by cell cycle stage

Affiliations

The rate of cell growth is governed by cell cycle stage

Alexi I Goranov et al. Genes Dev. .

Abstract

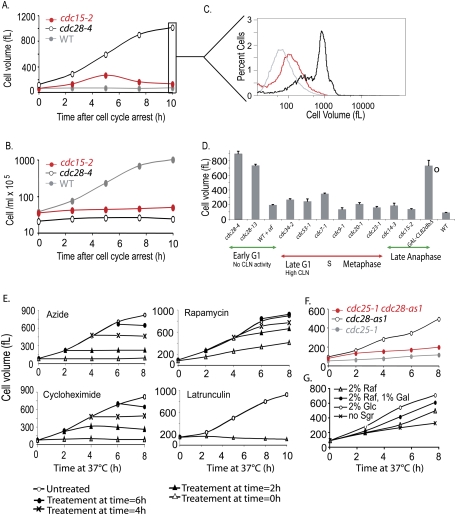
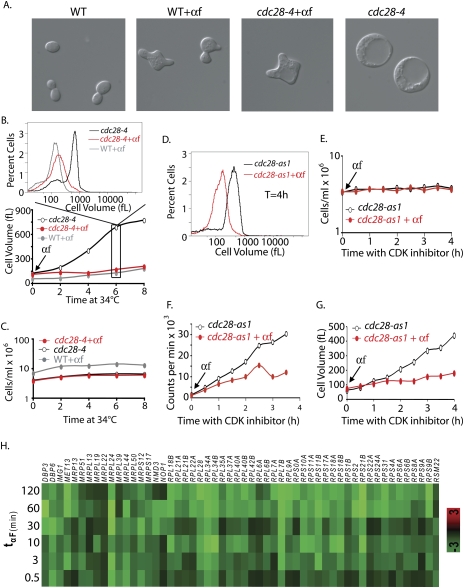
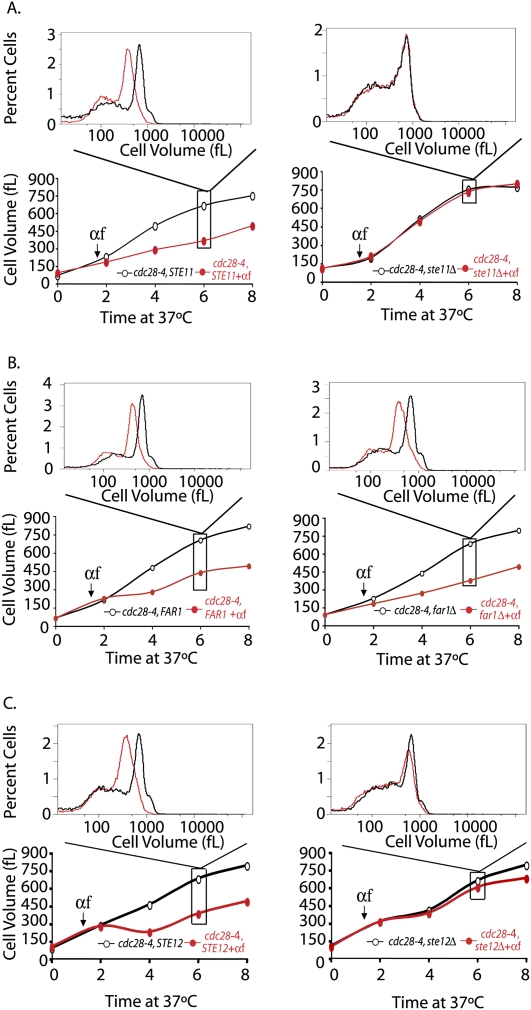
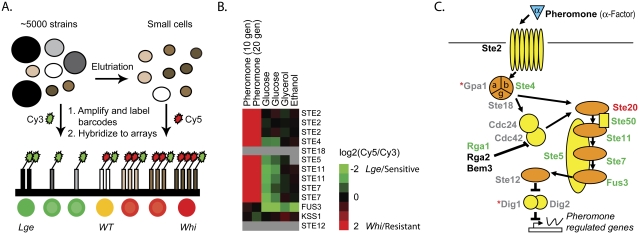
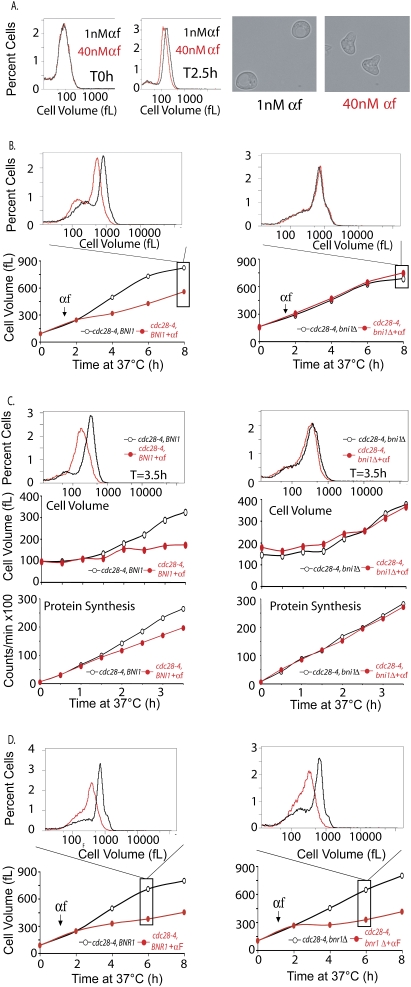
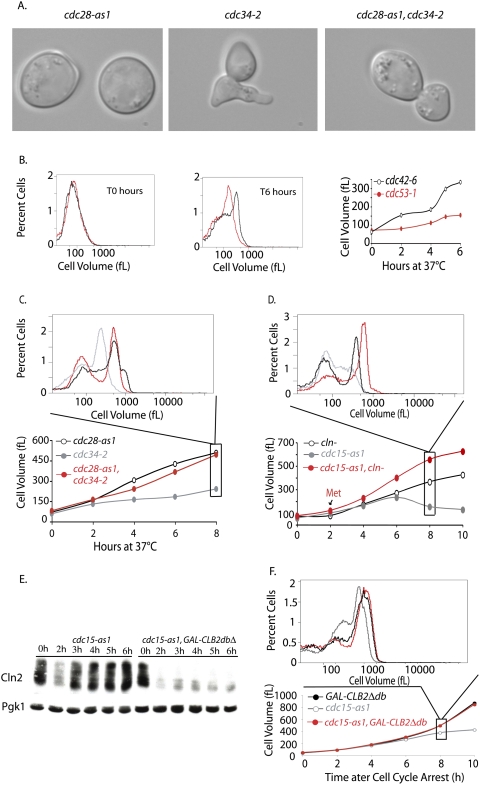
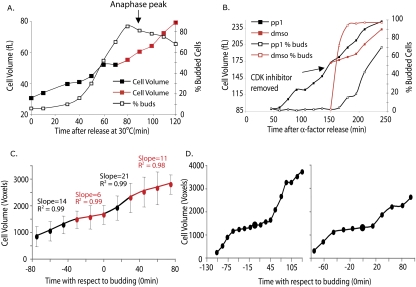
Cell growth is an essential requirement for cell cycle progression. While it is often held that growth is independent of cell cycle position, this relationship has not been closely scrutinized. Here we show that in budding yeast, the ability of cells to grow changes during the cell cycle. We find that cell growth is faster in cells arrested in anaphase and G1 than in other cell cycle stages. We demonstrate that the establishment of a polarized actin cytoskeleton-either as a consequence of normal cell division or through activation of the mating pheromone response-potently attenuates protein synthesis and growth. We furthermore show by population and single-cell analysis that growth varies during an unperturbed cell cycle, slowing at the time of polarized growth. Our study uncovers a fundamental relationship whereby cell cycle position regulates growth.


Figures

Figure 1.
Figure 1.
The ability of cells to grow is increased in G1 and anaphase-arrested cells. (A–C) Comparison of the sizes of wild-type (A2587), cdc28-4 (A17132), and cdc15-2 (A2596) cells. Cells were shifted to 37°C, and cell size (A) and cell number (B) were determined at the indicated times. C shows the cell size distributions of the strains in A after 10 h of temperature shift. (D) Exponentially growing yeast cells were arrested, and growth was monitored over a period of 10 h. cdc mutants carrying the indicated alleles were arrested at 37°C in YEPD. Pheromone arrest was maintained by repeated addition of α-factor to 20 μg/mL every 2 h. Cells carrying the GAL-CLB2dbΔ fusion (marked by ○ to indicate different growth temperature) were grown in YEP supplemented with 2% raffinose at 30°C. At the time of galactose addition (1%), cells were also shifted to 30°C. Wild-type cells were likewise shifted to 37°C, although the mode cell volume is similar at 30°C. The average peak (mode) cell volume for the 10 h time point of at least three independent replicates is shown (error bars represent standard deviation). The following strains were used for this analysis: wild type (A2587), cdc28-4 (A17132 or A2594), cdc28-13 (A4370), wild type with α-factor (A2589, bar1∷HisG), cdc34-2 (A1467), cdc53-1 (A1469), cdc7-1 (A344), cdc9-1 (A2599), cdc20-1 (A937), cdc23-1 (A785), cdc14-3 (A5321), cdc15-2 (A2596), and GAL-CLB2dbΔ (A17873). (E) The large size of cdc28-4 mutants is due to cell growth. cdc28-4 cells (A17132) were shifted to 37°C (0 h time point). At the indicated times, 5-mL aliquots were removed and treated with 0.1% azide, 200 μM latrunculin A, 10 μM rapamycin, or 0.33 mg/mL cycloheximide. Mode cell volume was measured for all subsequent time points in each drug-treated culture. (F) The RAS pathway is required for growth. Exponentially growing cdc25-1 (A20752), cdc28-as1 (A4370), and cdc25-1 cdc28-as1 double mutants (A21093) were shifted to 37°C and treated with 5 μM 1-NM-PP1 CDK inhibitor at time 0 h. Cell volume was determined at indicated times. (G) The volume increase of cdc28-4 mutants responds to carbon source identity. cdc28-4 cells (A17132) were grown to exponential phase in YEP supplemented with 2% raffinose. Upon shift to 37°C, cells were transferred into YEP medium either lacking any sugars, containing 2% raffinose, 2% raffinose with 1% galactose, or 2% glucose, and mode cell size distribution was determined.
Figure 2.
Figure 2.
Polarization limits growth in cdc28-4 mutants. The micrographs in A show wild-type (A2589) and cdc28-4 (A22928) cells at 6 h after the temperature shift with or without α-factor treatment. (B,C) Wild-type (A2589, bar1∷HisG; gray circles) and cdc28-4 bar1∷HisG (A22928) cells were shifted to 34°C and either treated with 20 μg/mL α-factor (black circles) or left untreated (red circles). Modal cell volume (B) and cell number (C) were determined at the indicated times. The cell volume distributions for the 6-h time point are shown above the graph in B. (D–G) cdc28-as1 (A4370) cells were shifted to 30°C and arrested with 5 μM CDK inhibitor, and 35S methionine and 35S cysteine (20 μCi/mL final each) were added. (F) The culture was split and either treated with mating pheromone (20 μg/mL; red circles) or mock-treated (black circles) and 35S incorporation into total protein was determined as described in Materials and Methods. A parallel culture treated identically but with unlabeled amino acids was used to determine cell number (E) and cell volume (G). The cell volume distribution of the two cultures at 4 h after temperature shift is shown in D. (H) Gene expression profile of 54 down-regulated RPs during mating in the wild-type strain (MT1567). Genome-wide gene expression was examined at different time points after pheromone addition. Down-regulated genes were significantly enriched for only one MIPS functional category: RPs (54 genes; P < 1.198e-06). Log2 (treated/untreated) values are indicated for each gene (y-axis) at various times (min) after pheromone addition (x-axis).
Figure 3.
Figure 3.
The mating pheromone pathway, but not the mating pheromone effector FAR1, is required for the growth inhibitory effects of mating pheromone. (A–C) Parallel cultures of cdc28-4 (A17132) and cdc28-4 ste11Δ (A18205) (A), cdc28-4 (A17132) and cdc28-4 far1Δ (A18204) (B), and cdc28-4 (A17132) and cdc28-4 ste12Δ (A18434) (C) were shifted to 37°C (0-h time point). After 90 min, cells were either treated with mating pheromone (20 μg/mL; red circles) or left untreated (black circles). Pheromone was readded every 2 h. Mode cell volume was determined at the indicated times. The histograms above each plot display the cell volume distribution 6 h after temperature shift.
Figure 4.
Figure 4.
The pheromone pathway affects cell size during exponential growth. (A) Mixed yeast haploid deletion pools were elutriated to enrich for small cells. Unique bar codes from yeast pools collected immediately before and after elutriation were amplified and differentially labeled with Cy3 (before) and Cy5 (after) and hybridized to bar code microarrays. Green indicates depletion by elutriation (lge cells) while red indicates enrichment (whi cells). (B) Elutriation bar code microarrays experiments were performed with different rich (glucose) (Cook et al. 2008) or poor (glycerol, ethanol) carbon sources. Fitness experiments were performed in the presence of mating pheromone. A number of pheromone pathway gene deletions display a large cell size in the absence of pheromone, and in a manner dependent on the carbon source. The degree of enrichment (small = whi; pheromone-resistant; red) or depletion (large = lge; pheromone sensitive; green) for both upstream and downstream bar codes is expressed as log2(elutriated/total) or log2(treated/untreated) and is indicated by the color bar. Gray indicates no available data either due to insufficient signal or the absence of the strain from the deletion pool. (C) Schematic of the mating pathway. The cell size of gene deletions, relative to the deletion pool, is indicated by the text color: lge (green), whi (red), wild type (black), and no viable data (gray). gpa1Δ and dig1Δ (red asterisks) were both found to be lge; however, they displayed the incorrect pheromone sensitivity/resistance phenotype, likely due to secondary mutations, and were thus excluded.
Figure 5.
Figure 5.
BNI1 but not BNR1 is required for the growth inhibitory effect of pheromone. (A) Mutants that are hypersensitive to mating pheromone, bar1 (A4370), were grown in YPE media supplemented with 2% glucose at 30°C. The culture was split and treated with a final concentration of either 1 nM pheromone (black) or40 nM pheromone (red). After 2.5 h, aliquots were collected and analyzed for budding, the percent of cells with shmoos, and cell volume distributions (see text for details). Images of cells were taken 2.5 h after pheromone addition. (B,D) cdc28-4 (A17132) and cdc28-4 bni1Δ (A18238) cells (B) or cdc28-4 (A17132) and cdc28-4 bnr1Δ (A19911) cells (D) were grown as described in Figure 3A, and the cell volume distributions were determined at indicated times points. The histograms above each plot display the cell volume distribution 6 h (D) or 8 h (B) after temperature shift. (C) Cell volume (middle) and protein synthesis (bottom) rates were determined for cdc28-4 (A17132) and cdc28-4 bni1Δ (A18238) cells in the presence and absence of pheromone as described in Figure 2F. (Top) The cell volume distribution of each culture 3.5 h after temperature shift is shown in the histogram.
Figure 6.
Figure 6.
The limited growth of SCF and MEN mutants is due to Cln-CDK activity. (A,C) cdc34-2 (A1467), cdc28-as1 (A4370), and cdc34-2 cdc28-as1 (A17188) cells were shifted to 37°C (0 h time point). Single mutants were treated with 5 μM 1-NM-PP1 inhibitor at the time of temperature shift. The double mutant was grown for 2 h at 37°C, by which time ∼80% of the double mutants had budded, which was followed by addition of CDK inhibitor. (A) Micrographs of mutants after 4 h of growth at 37°C. (B) Comparison of the growth of cdc42-6 (A18221) and cdc53-1 (A1469) mutants. Exponentially growing cells were shifted from room temperature to 37°C, and growth was monitored using a Coulter counter. Cell volume distribution for both strains is shown for the T0 h and T6 h time points, and the mode cell volume for the complete time course is plotted. (C) Inactivation of Cdc28 rescues the growth inhibition of cdc34-2 mutants. Cell size distributions were measured at the indicated time points after shift to 37°C. The histogram above displays the cell volume distribution 8 h after temperature shift. Cells were grown as described in A. (D) Depletion of Cln-CDKs allows cdc15-2 mutants to grow in size. MET-CLN2 cln3Δ cln1Δ (A2624; red circles), cdc15-as1 (A17872; gray circles), and MET-CLN2 cln3Δ cln1Δ cdc15-as1 (A18316; black circles) cells were grown to exponential phase in synthetic complete medium lacking methionine. Cells were transferred into YEPD at 37°C in the presence of 10 μM 1-N-PP1 inhibitor to inhibit the cdc15-as1 allele (0 h time point). The single mutants were treated with 8 mM methionine at the time of temperature shift and cdc15-as1 inhibition, to repress Cln2 production. The double mutant was grown in the absence of methionine for 2 h to allow cells to accumulate in the cdc15-as1 block prior to methionine addition. Subsequently, 8 mM methionine was readded every 2 h to all cultures. Cell size distributions were measured at the indicated time points after shift to 37°C. The histogram above displays the cell volume distribution 8 h after temperature shift. (E) CLNs accumulate in cdc15-as1-arrested cells, but not in cdc15-as1-arrested cells overexpressing CLB2dbΔ. cdc15-as1 (A18982) and cdc15-as1 GAL-CLB2dbΔ (A18986) strains, both expressing a tagged version of CLN2 (Cln2-3xHA), were pregrown at 30°C in YPE supplemented with 2% raffinose. At time 0 h, 10 μM 1-N-PP1 inhibitor and 1% galactose were added to both strains to inhibit cdc15-as1 and to induce CLB2dbΔ, respectively. Samples were withdrawn at the indicated times. Samples were run by 10% SDS-PAGE and prior to transfer to a membrane and blotting. The membrane was blotted with anti-HA antibody to detect Cln2-3X-HA. The same membrane was stripped and reprobed with anti-Pgk1 antibody. (F) Expression of a stable form of Clb2 rescues the growth phenotype of MEN mutants. cdc15-as1 (A17873), GAL-CLB2 dbΔ (A17872), and cdc15-as1 GAL-CLB2 dbΔ double mutant (A17874) were arrested in YPE supplemented with 2% rafinose media with α-factor for 90 min after which 1% galactose was added to induce the expression of Clb2Δdb. Cells were further incubated with α-factor for 45 min and were released into fresh YPE media supplemented with 2% raffinose and 1% galactose at 30°C. At this time, Cdc15-as1 inhibitor, 1-N-PP1, was added to all strains at 10 μM concentration. The volume of all strains was monitored to 10 h. The mode cell volume for each time point is plotted: cdc15-as1 (gray circles), GAL-CLB2dbΔ (black circles), and double mutant (red circles).
Figure 7.
Figure 7.
Growth rates change during the cell cycle. (A) Wild-type cells (A2587) grown in YEP + 2% glucose were elutriated at 4°C to collect small G1 cells. The collected cells were transferred to YEP supplemented with 2% glucose at 30°C, and cell volume (black or red filled squares), budding (black, open squares), and percent anaphase cells (anaphase peak indicated with an arrow) were determined at the indicated times. Similar observations were made in at least three independent experiments (Supplemental Fig. 5B). (B) cdc28-as1 cells (A18367) were arrested at 22°C with α-factor for 2.5 h to allow accumulation of cells in G1. Subsequently, cells were released from arrest in the presence of 20 μM 1-NM-PP1 inhibitor at 30°C, and the cell volume and budding were determined at 15-min intervals. After 135 min, the culture was washed to remove the CDK inhibitor and resuspended in medium containing either CDK inhibitor (black) or DMSO (red). Cell volume (filled squares) and budding (open squares) were determined at the indicated times following the 135-min time point. Similar observations were made in at least three independent experiments (Supplemental Fig. 5A). (C) Wild-type cells (A2597) were grown in a microfluidic device in YPD media at room temperature. Cells were synchronized with pheromone for 1.5 h and released in fresh YPD media, and the growth properties of their decedents were analyzed. Pheromone-treated cells were not included in the analysis to eliminate effects of pheromone treatment on growth in the ensuing cell cycle. Images of cells were acquired every 15 min by automated time-lapse microscopy. Image processing algorithms were used to calculate the cell volumes as described in Materials and Methods. Calculated cell volumes of individual cells (volume of mother + volume of bud) were plotted versus the time of bud emergence (T = 0 min). The data plotted are the average of the growth patterns of 20 individual cells. The plot was segmented into four linear parts, and the fit to a linear for each segment (slope and R 2) is indicated. (D) The growth of two individual cells from the experiment, which were used to produce the average in C.

References

    1. Adams AE, Johnson DI, Longnecker RM, Sloat BF, Pringle JR. CDC42 and CDC43, two additional genes involved in budding and the establishment of cell polarity in the yeast Saccharomyces cerevisiae. J Cell Biol. 1990;111:131–142. - PMC - PubMed
    1. Amberg DC. Three-dimensional imaging of the yeast actin cytoskeleton through the budding cell cycle. Mol Biol Cell. 1998;9:3259–3262. - PMC - PubMed
    1. Amon A. Synchronization procedures. Methods Enzymol. 2002;351:457–467. - PubMed
    1. Amon A, Irniger S, Nasmyth K. Closing the cell cycle circle in yeast: G2 cyclin proteolysis initiated at mitosis persists until the activation of G1 cyclins in the next cycle. Cell. 1994;77:1037–1050. - PubMed
    1. Barbet NC, Schneider U, Helliwell SB, Stansfield I, Tuite MF, Hall MN. TOR controls translation initiation and early G1 progression in yeast. Mol Biol Cell. 1996;7:25–42. - PMC - PubMed

Publication types

MeSH terms

LinkOut - more resources