. 2009 Jul;175(1):132-47.
doi: 10.2353/ajpath.2009.081002. Epub 2009 Jun 15.

A transgenic mouse model of inducible macrophage depletion: effects of diphtheria toxin-driven lysozyme M-specific cell lineage ablation on wound inflammatory, angiogenic, and contractive processes

Affiliations

A transgenic mouse model of inducible macrophage depletion: effects of diphtheria toxin-driven lysozyme M-specific cell lineage ablation on wound inflammatory, angiogenic, and contractive processes

Itamar Goren et al. Am J Pathol. 2009 Jul.

Abstract

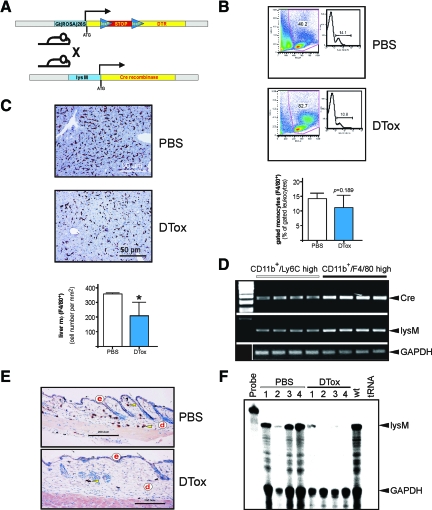
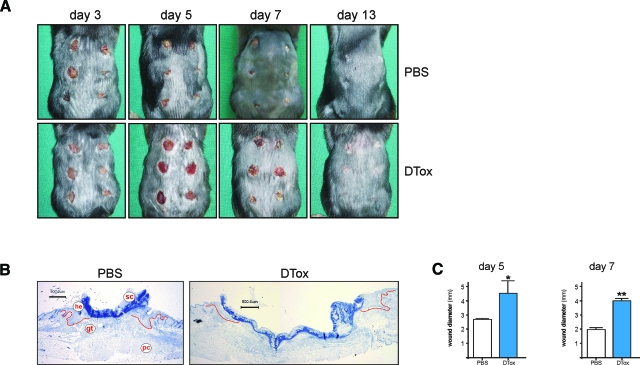
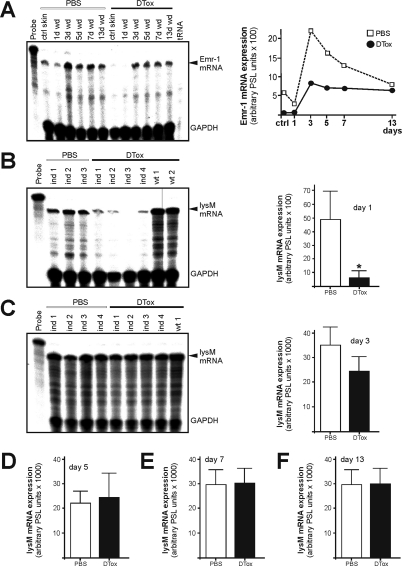
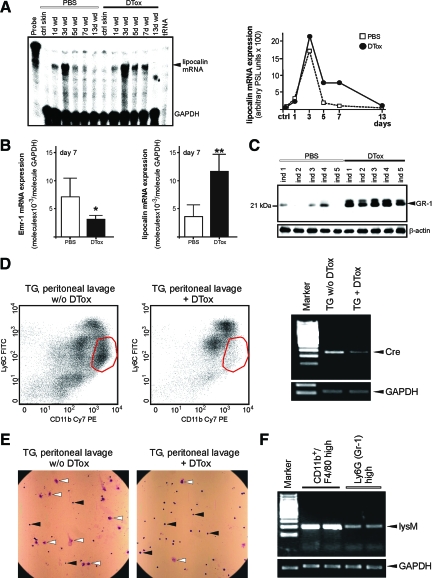
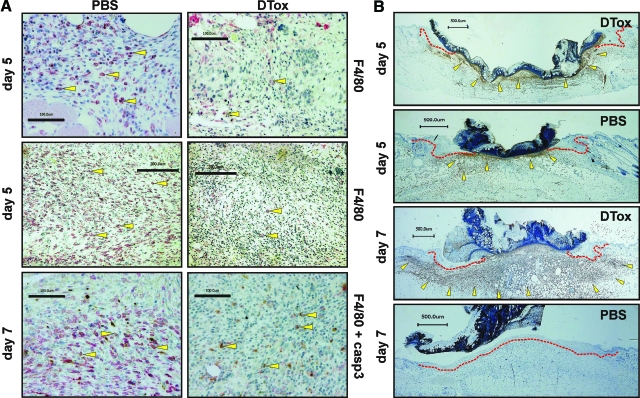
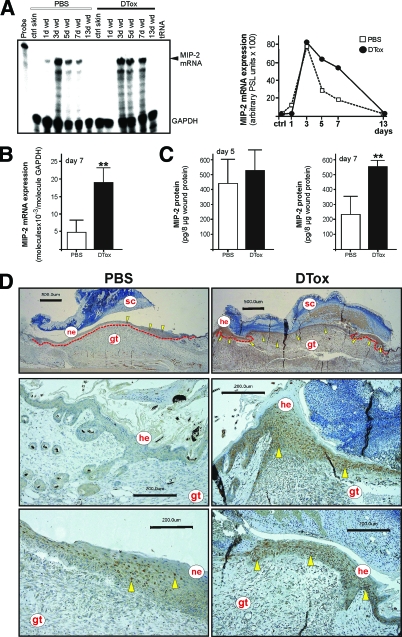
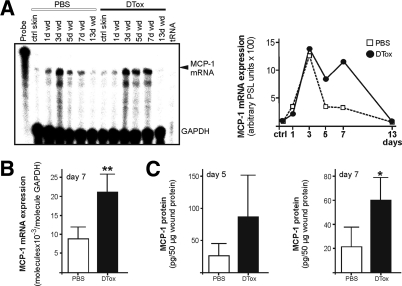
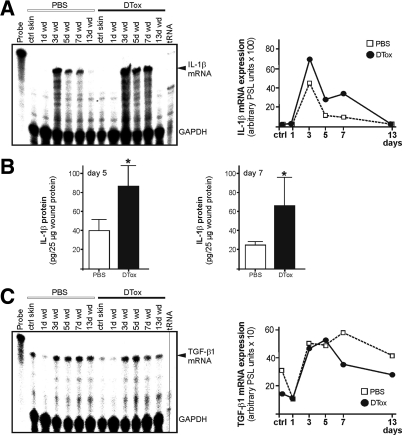
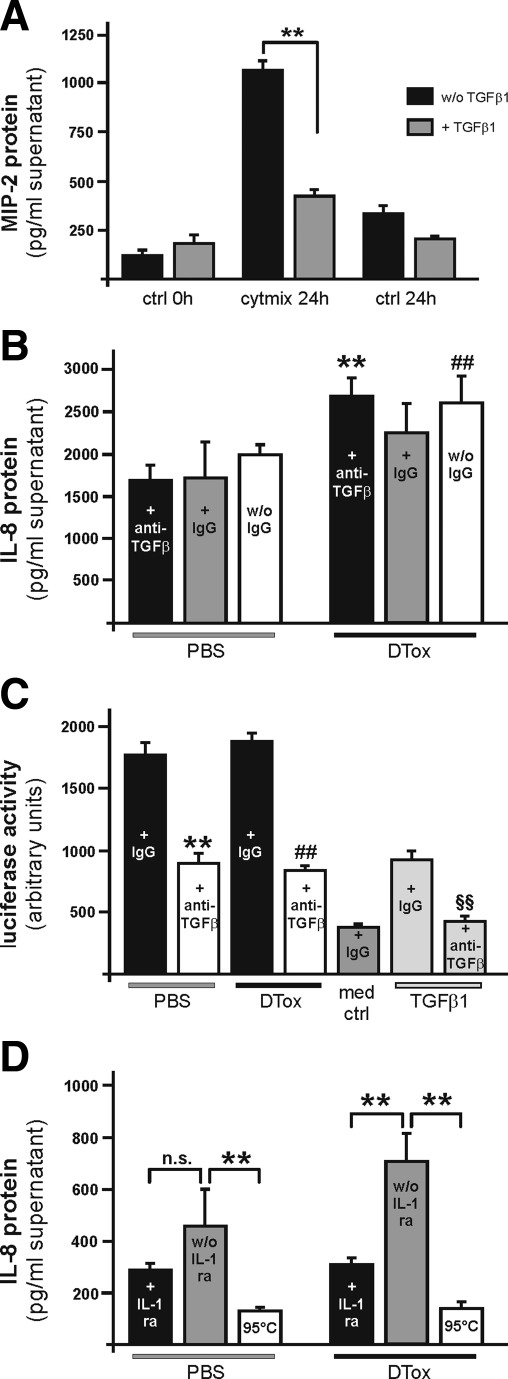
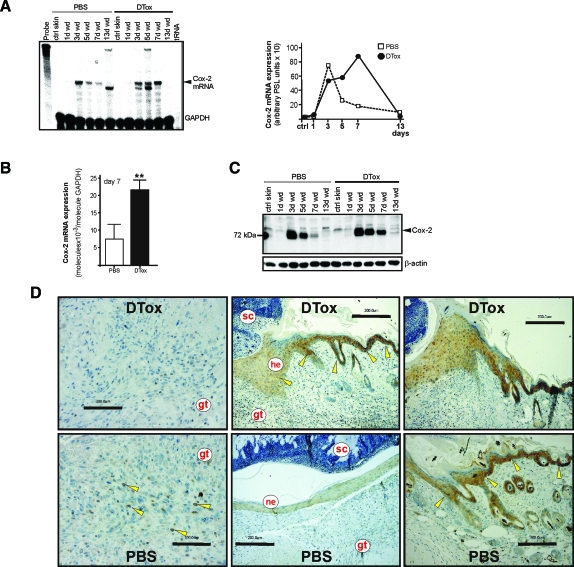
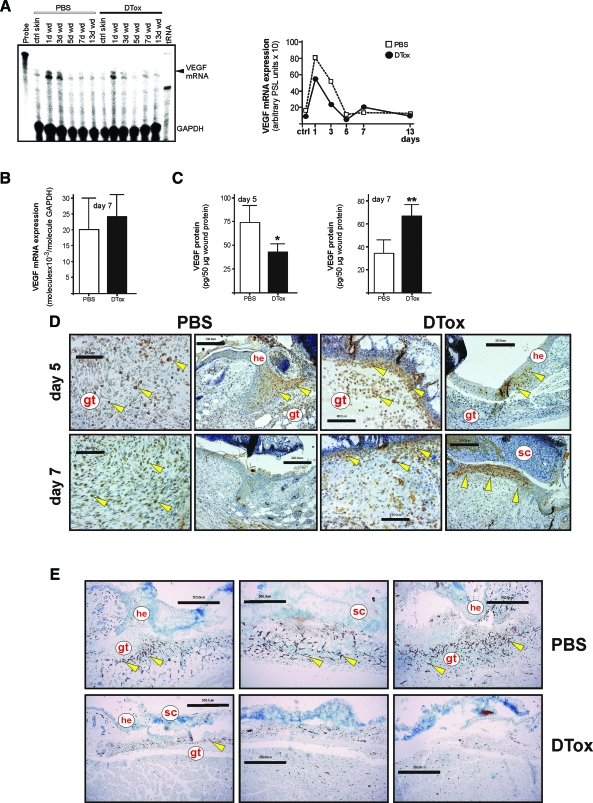
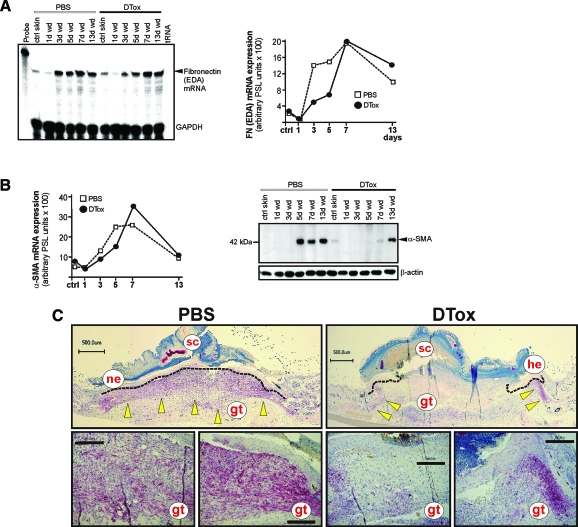
Whether the wound macrophage is a key regulatory inflammatory cell type in skin repair has been a matter of debate. A transgenic mouse model mediating inducible macrophage depletion during skin repair has not been used to date to address this question. Here, we specifically rendered the monocyte/macrophage leukocyte lineage sensitive to diphtheria toxin by expressing the lysozyme M promoter-driven, Cre-mediated excision of a transcriptional STOP cassette from the simian DT receptor gene in mice (lysM-Cre/DTR). Application of diphtheria toxin to lysM-Cre/DTR mice led to a rapid reduction in both skin tissue and wound macrophage numbers at sites of injury. Macrophage-depleted mice revealed a severely impaired wound morphology and delayed healing. In the absence of macrophages, wounds were re-populated by large numbers of neutrophils. Accordingly, macrophage-reduced wound tissues exhibited the increased and prolonged persistence of macrophage inflammatory protein-2, macrophage chemoattractant protein-1, interleukin-1beta, and cyclooxygenase-2, paralleled by unaltered levels of bioactive transforming growth factor-beta1. Altered expression patterns of vascular endothelial growth factor on macrophage reduction were associated with a disturbed neo-vascularization at the wound site. Impaired wounds revealed a loss of myofibroblast differentiation and wound contraction. Our data in the use of lysM-Cre/DTR mice emphasize the pivotal function of wound macrophages in the integration of inflammation and cellular movements at the wound site to enable efficient skin repair.


Figures

Figure 1
Figure 1
Inducible macrophage depletion in lysM-Cre/DTR mice. A: Scheme of the inducible DTR mouse strain. The STOP cassette, which prevents expression of the functional DTR, is removed by crossing the DTR mouse strain to a lysM-Cre myeloid cell lineage-specific Cre-expressing mouse strain. Consecutive expression of the DTR renders the respective tissue sensitive to cell death induced by injection of DT. B: Circulating F4/80-positive monocytes in lysM-Cre/DTR mice. Mice had been injected with PBS or DTox (for three consecutive days) as indicated. Fresh blood was analyzed for F4/80-positive monocytes by FACS. One representative animal for each treatment is shown, a statistical analysis is given below. P = 0.189 (unpaired Student’s t-test) versus PBS-treated mice. Bars indicate the mean ± SD from five individual animals (n = 5). C: Immunohistological quantification of F4/80-positive liver tissue macrophages (Kupffer cells). Mice had been injected with PBS or DTox (for three consecutive days) as indicated. Representative sections from PBS- and DTox-treated mice are shown. Absolute numbers of F4/80-positive macrophages from analyzed liver sections are given in the lower panel. *P < 0.05 (unpaired Student’s t-test) versus PBS-treated mice. Bars indicate the mean ± SD from five individual animals (n = 5). D: RT-PCR analyses showing Cre and lysM mRNA expression in monocytes (CD11b+/Ly6C high) and macrophages (CD11b+/F4/80 high) as indicated. Four independent preparations from bone marrow are shown for each cell fraction. An amplification of GAPDH is shown for equal loading. E: Paraffin sections from non-wounded skin isolated from PBS- and DTox-injected mice as indicated were incubated with an antibody directed against macrophage-specific F4/80 protein. Sections were stained with the avidin-biotin-peroxidase complex system. Nuclei were counterstained with hematoxylin. Immunopositive signals were indicated by yellow arrows. Scale bars are given in the photographs. d, dermis; e, epidermis. F: Lysozyme M mRNA expression in non-wounded skin tissue isolated from PBS- and DTox-injected mice as indicated. Mice had been injected with PBS or DTox (for three consecutive days) before analysis. #1–4 represent individual animals. For the RNase protection assay, every experimental time point depicts three wounds (n = 3) isolated from a single individual mouse. GAPDH hybridization is shown as a loading control; 1000 cpm of the hybridization probe were used as a size marker. Hybridization against tRNA was used to show the specificity of the probe.
Figure 2
Figure 2
Wound closure in DTox-treated lysM-Cre/DTR mice. A: Photographs of back skin wounds (day 3 to 13 post-wounding) in PBS- and DTox-injected mice as indicated. B: Representative histological analyses of 5 day wound tissue isolated from PBS- and DTox-injected mice as indicated. Formalin-fixed, paraffin-embedded, 4-μm sections were counterstained using hematoxylin. gt, granulation tissue; he, hyperproliferative epithelium; pc, panniculus carnosus; sc, scab. Scale bar = 500 μm. C: Wound diameter of 5 day and day 7 wounds in PBS- and DTox-injected mice. **P < 0.01; *P < 0.05 (unpaired Student’s t-test) versus PBS-injected mice. Bars indicate the mean ± SD from 30 wounds (n = 30) from five individual animals (n = 5).
Figure 3
Figure 3
Analysis of wound macrophages in DTox-injected lysM-Cre/DTR mice. A: Emr-1 mRNA expression during skin repair in PBS- and DTox-injected mice as indicated (left panel). A quantification of Emr-1 mRNA of the respective RNase protection assay gel is shown in the right panel. LysM mRNA expression in 1 day (B), 3 day (C), 5 day (D), 7 day (E), and 13 day (F) wound tissue in PBS- and DTox-injected mice. Ind 1–4 represent individual LysM-Cre/DTR animals as assessed by RNase protection assay (left panels). Wt represents a non-transgenic littermate. Every experimental time point depicts three wounds (n = 3) isolated from a single individual mouse. Quantifications of lysM mRNA from the respective RNase protection assay gels from day 3, 5, 7, and 13 post-wounding are shown in the right panels. *P < 0.05 (unpaired Student’s t-test) versus PBS-injected mice. Bars indicate the mean ± SD from 15 wounds (n = 15) from five individual animals (n = 5).
Figure 4
Figure 4
Analysis of wound neutrophils in DTox-injected lysM-Cre/DTR mice. A: LysM mRNA expression during skin repair in PBS- and DTox-injected mice as indicated (left panel). A quantification of lysM mRNA from data points of the respective RNase protection assay gel is shown in the right panel. B: qRT-PCR quantifications of Emr-1 (left panel) and lipocalin (right panel) mRNA expression from 7 day wound tissue from five individual mice (n = 5) to demonstrate the individual variability of the respective signal. Bars indicate the mean ± SD obtained from wounds (n = 3) isolated from five individual animals (n = 5). **P < 0.01; *P < 0.05 (unpaired Student’s t-test) as compared with PBS-treated mice. C: 50 μg of total protein from 7 day wounds of PBS- and DTox-injected mice was analyzed by immunoblot for the presence of the neutrophil surface marker protein GR-1. Every single data point depicts 2 wounds (n = 2) from a single individual animal (ind 1–5). β-actin was used to control equal loading. D: Peritoneal cellular isolates from a thioglycollate (TG)-induced peritonitis in lysM-Cre/DTR after 5 days. 24 hours before isolation of cells from the peritoneum, mice were injected with DTox (TG + DTox) or PBS (TG w/o DTox). Isolated cell fractions were analyzed by FACS. The red circle determines the macrophage fraction (CD11b high, Ly6C low). RT-PCR analysis showing Cre mRNA expression in the respective peritoneal cellular isolates from TG-treated mice in the presence (TG + DTox) or absence (TG w/o DTox) of DTox. Pooled isolates from 3 mice are shown on each lane. An amplification of GAPDH is shown for equal loading. E: Microscopic view on isolated peritoneal cellular isolates from TG-treated mice in the presence (TG + DTox) or absence (TG w/o DTox) of DTox. White arrows, macrophages; black arrows, neutrophils or monocytes. F: RT-PCR analysis showing lysM mRNA expression in bone marrow-derived, in vitro-differentiated macrophages (CD11b+/F4/80 high) and freshly isolated neutrophils (Ly6G high) as indicated. 2 independent preparations are shown for each cell fraction. An amplification of GAPDH is shown for equal loading.
Figure 5
Figure 5
DTox eliminates macrophages from wound tissue. Paraffin sections from day 5 and 7 wounds isolated from PBS- and DTox-injected mice as indicated were incubated with antibodies directed against macrophage-specific F4/80 and active caspase-3 (A) or neutrophil-specific GR-1 (B) protein. Immunopositive signals were indicated by yellow arrows. The epithelial wound margins are indicated by a red line in (B). Scale bars are given in the photographs.
Figure 6
Figure 6
MIP-2 expression in macrophage-depleted wounds. A: MIP-2 mRNA expression during skin repair in PBS- and DTox-injected mice as indicated (left panel). A quantification of MIP-2 mRNA from data points of the respective RNase protection assay gel is shown in the right panel. B: qRT-PCR quantifications of MIP-2 mRNA expression from 7 day wound tissue from five individual mice (n = 5) to demonstrate the individual variability of the respective signal. Bars indicate the mean ± SD obtained from wounds (n = 3) isolated from five individual animals (n = 5). **P < 0.01 (unpaired Student’s t-test) as compared with PBS-treated mice. C: MIP-2 specific ELISA analyses from 5 day (left panel) and 7 day (right panel) wound lysates from PBS- and DTox-injected mice. MIP-2 protein is expressed as pg/8 μg skin or section lysate. Bars indicate the mean ± SD obtained from wounds (n = 2) isolated from five animals (n = 5). **P < 0.01 (unpaired Student’s t-test) as compared with PBS-treated mice. D: Paraffin sections from day 7 wound tissue isolated from PBS- and DTox-injected mice were incubated with an antibody directed against MIP-2 protein. Immunopositive signals were indicated by yellow arrows. The epithelial wound margins are indicated by a red line in the upper panels. Scale bars are given in the photographs. gt, granulation tissue; he, hyperproliferative epithelium; ne, neo-epithelium; sc, scab.
Figure 7
Figure 7
MCP-1 expression in macrophage-depleted wounds. A: MCP-1 mRNA expression during skin repair in PBS- and DTox-injected mice as indicated (left panel). A quantification of MIP-2 mRNA from data points of the respective RNase protection assay gel is shown in the right panel. B: qRT-PCR quantifications of MCP-1 mRNA expression from 7-day wound tissue from five individual mice (n = 5) to demonstrate the individual variability of the respective signal. Bars indicate the mean ± SD obtained from wounds (n = 3) isolated from five individual animals (n = 5). **P < 0.01 (unpaired Student’s t-test) as compared with PBS-treated mice. C: MCP-1 specific ELISA analyses from 5 day (left panel) and 7 day (right panel) wound lysates from PBS- and DTox-injected mice. MCP-1 protein is expressed as pg/50 μg skin or section lysate. Bars indicate the mean ± SD obtained from wounds (n = 2) isolated from five animals (n = 5). *P < 0.05 (unpaired Student’s t-test) as compared with PBS-treated mice.
Figure 8
Figure 8
Expression of pro- and anti-inflammatory mediators in macrophage-depleted wounds. A: IL-1β mRNA expression during skin repair in PBS- and DTox-injected mice as indicated (left panel). A quantification of IL-1β mRNA from data points of the respective RNase protection assay gel is shown in the right panel. B: IL-1β specific ELISA analyses from 5 day (left panel) and 7 day (right panel) wound lysates from PBS- and DTox-injected mice. IL-1β protein is expressed as pg/25 μg skin or section lysate. Bars indicate the mean ± SD obtained wounds (n = 2) isolated from five animals (n = 5). *P < 0.05 (unpaired Student’s t-test) as compared with PBS-treated mice. C: TGF-β1 mRNA expression during skin repair in PBS- and DTox-injected mice as indicated (left panel). A quantification of TGF-β1 mRNA from data points of the respective RNase protection assay gel is shown in the right panel.
Figure 9
Figure 9
IL-1 signaling pathways contribute to augmented inflammation in macrophage-depleted wounds. A: Confluent primary keratinocytes from C57Bl/6J mice were analyzed for the release of MIP-2 in the presence or absence of cytokines (40 ng/ml IL-1β, 25 ng/ml tumor necrosis factor-α, 20 ng/ml U/ml interferon-γ) or TGF-β1 (5 ng/ml) after 20 hours as indicated. **P < 0.01 as indicated by the brackets. Bars depict means ± SD obtained from three independent cell culture experiments (n = 3). B: Confluent human HaCaT keratinocytes were stimulated with pooled wound lysates (n = 25 wounds from 5 individual animals) (f.c. 100 μg/ml) of PBS- or- DTox-treated lysM-Cre/DTR mice. Lysates were treated with an anti-TGFβ antibody (10 μg/ml), a non-specific IgG (10 μg/ml) or left untreated (w/o IgG). IL-8 was determined from cell culture supernatants after 24 by ELISA. **, ##, P < 0.01 as compared with the respective bar in PBS-control. Bars depict means ± SD obtained from three independent cell culture experiments (n = 3). C: Mink lung epithelial reporter cells were stimulated with fresh wound lysates (n = 25 wounds from 5 individual animals) (f.c. 400 μg/ml) of PBS- or- DTox-treated lysM-Cre/DTR mice in the presence or absence of an anti-TGFβ antibody (100 μg/ml). Medium containing non-specific IgG (med + IgG), or TGF-β1 (0.8 ng/ml) with non-specific IgG or an anti-TGFβ antibody (100 μg/ml) were used to control reactivity of the reporter cells. TGF-β bioactivity is expressed as stimulation of relative luminescence units (RLU) derived from luciferase enzymatic activity induced from a TGF-β-sensitive plasminogen activator inhibitor promoter in the cells. D: Confluent human HaCaT keratinocytes were stimulated with pooled wound lysates (n = 25 wounds from 5 individual animals) (f.c. 100 μg/ml) of PBS- or- DTox-treated lysM-Cre/DTR mice. Cells were pre-treated with IL-1ra (500 μg/ml) (+IL-1ra) or left untreated (w/o IL-1ra). Heated lysate (95°C) was used as a control. IL-8 was determined from cell culture supernatants after 24 by ELISA. **P < 0.01; n.s, not significant as indicated by the brackets. Bars depict means ± SD obtained from three independent cell culture experiments (n = 3).
Figure 10
Figure 10
Cox-2 expression in macrophage-depleted wounds. A: Cox-2 mRNA expression during skin repair in PBS- and DTox-injected mice as indicated (left panel). A quantification of Cox-2 mRNA from data points of the respective RNase protection assay gel is shown in the right panel. B: qRT-PCR quantifications of Cox-2 mRNA expression from 7-day wound tissue from 5 individual mice (n = 5) to demonstrate the individual variability of the respective signal. Bars indicate the mean ± SD obtained from wounds (n = 3) isolated from five individual animals (n = 5). **P < 0.01 (unpaired Student’s t-test) as compared with PBS-treated mice. C: 50 μg of total protein from non-wounded ctrl skin and wound tissue (day 1, 3, 5, 7, and 13) of PBS- and DTox-injected mice was analyzed by immunoblot for the presence of Cox-2 protein. The immunoblot from one representative experimental series is shown. β-actin was used to control equal loading. D: Paraffin sections from day-7 wound tissue isolated from PBS- and DTox-injected mice were incubated with an antibody directed against Cox-2 protein. Immunopositive signals were indicated by yellow arrows. Scale bars are given in the photographs. gt, granulation tissue; he, hyperproliferative epithelium; ne, neo-epithelium; sc, scab.
Figure 11
Figure 11
Dysregulated VEGF expression and localization in macrophage-depleted wounds. A: VEGF mRNA expression during skin repair in PBS- and DTox-injected mice as indicated (left panel). A quantification of VEGF mRNA from data points of the respective RNase protection assay gel is shown in the right panel. B: qRT-PCR quantifications of VEGF mRNA expression from 7-day wound tissue from five individual mice (n = 5) to demonstrate the individual variability of the respective signal. Bars indicate the mean ± SD obtained from wounds (n = 3) isolated from five individual animals (n = 5). C: VEGF-specific ELISA analyses from 5 day (left panel) and 7 day (right panel) wound lysates from PBS- and DTox-injected mice. VEGF protein is expressed as pg/50 μg skin or section lysate. Bars indicate the mean ± SD obtained from wounds (n = 2) isolated from five animals (n = 5). **P < 0.01; *P < 0.05 (unpaired Student’s t-test) as compared with PBS-treated mice. D: Paraffin sections from 5-day (upper panels) and 7-day (lower panels) wound tissue isolated from PBS- and DTox-injected mice were incubated with an antibody directed against VEGF protein. Immunopositive signals were indicated by yellow arrows. E: Paraffin sections from day 5 wound tissue isolated from PBS- and DTox-injected mice were incubated with an antibody directed against CD31 protein. Immunopositive signals were indicated by yellow arrows. Scale bars are given in the photographs. gt, granulation tissue; he, hyperproliferative epithelium; sc, scab.
Figure 12
Figure 12
Impaired differentiation of myofibroblasts in macrophage-depleted wounds. A: ED-A fibronectin mRNA expression during skin repair in PBS- and DTox-injected mice as indicated (left panel). A quantification of ED-A fibronectin mRNA from data points of the respective RNase protection assay gel is shown in the right panel. B: Quantification of α-SMA mRNA (left panel). Fifty micrograms of total protein from non-wounded ctrl skin and wound tissue (day 1, 3, 5, 7, and 13) of PBS- and DTox-injected mice was analyzed by immunoblot for the presence of α-SMA protein (right panel). The immunoblot from one representative experimental series is shown. β-actin was used to control equal loading. C: Paraffin sections from day 7 wound tissue isolated from PBS- and DTox-injected mice were incubated with an antibody directed against α-SMA protein. Immunopositive signals were indicated by yellow arrows. Scale bars are given in the photographs. gt, granulation tissue; he, hyperproliferative epithelium; ne, neo-epithelium; sc, scab.

References

    1. Simpson DM, Ross R. The neutrophilic leukocyte in wound repair: a study with antineutrophil serum. J Clin Invest. 1972;51:200–223. - PMC - PubMed
    1. Leibovich SJ, Ross R. The role of the macrophage in wound repair: a study with hydrocortisone and antimacrophage serum. Am J Pathol. 1975;78:71–100. - PMC - PubMed
    1. DiPietro LA, Burdick M, Low QE, Kunkel SL, Strieter RM. MIP-1alpha as a critical macrophage chemoattractant in murine wound repair. J Clin Invest. 1998;101:1693–1698. - PMC - PubMed
    1. Devalaraja RM, Nanney LB, Du J, Qian Q, Yu Y, Devalaraja MN, Richmond A. Delayed wound healing in CXCR2 knockout mice. J Invest Dermatol. 2000;115:234–244. - PMC - PubMed
    1. Peters T, Sindrilaru A, Hinz B, Hinrichs R, Menke A, Al-Azzeh EA, Holzwarth K, Oreshkova T, Wang H, Kess D, Walzog B, Sulyok S, Sunderkötter C, Friedrich W, Wlaschek M, Krieg T, Scharffetter-Kochanek K. Wound healing defect of CD18−/− mice due to a decrease in TGF-β1 and myofibroblast differentiation. EMBO J. 2005;24:3400–3410. - PMC - PubMed

Publication types

MeSH terms