. 2009 Jul;175(1):400-11.
doi: 10.2353/ajpath.2009.080972. Epub 2009 Jun 15.

Hypoxia-mediated up-regulation of Pim-1 contributes to solid tumor formation

Affiliations

Hypoxia-mediated up-regulation of Pim-1 contributes to solid tumor formation

Jian Chen et al. Am J Pathol. 2009 Jul.

Abstract

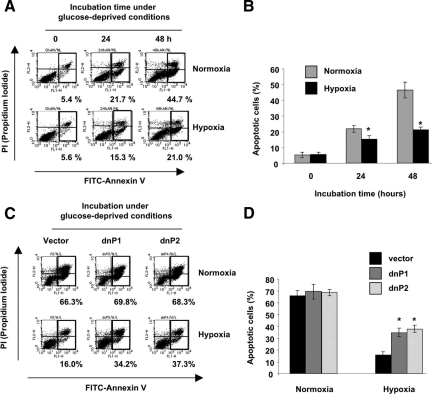
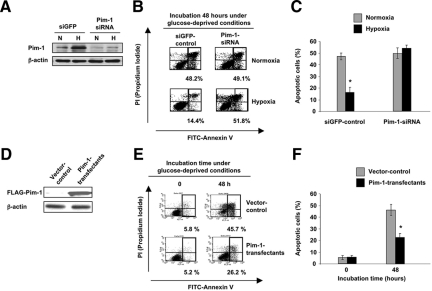
Tumor hypoxia directly promotes genomic instability and facilitates cell survival, resulting in tumors with a more aggressive phenotype. The proto-oncogene pim-1 regulates apoptosis and the cell cycle by phosphorylating target proteins. Overexpression of Pim-1 can cause genomic instability and contribute to lymphomagenesis. It is not clear whether Pim-1 is involved in hypoxia-mediated tumor survival in solid tumors. Here, we show that hypoxia can stabilize Pim-1 by preventing its ubiquitin-mediated proteasomal degradation and can cause Pim-1 translocation from the cytoplasm to the nucleus. Importantly, overexpression of Pim-1 increases NIH3T3 cell transformation exclusively under hypoxic conditions, suggesting that Pim-1 expression under hypoxia may be implicated in the transformation process of solid tumors. Also, blocking Pim-1 function by introduction of dominant negative Pim-1 resensitizes pancreatic cancer cells to apoptosis induced by glucose-deprivation under hypoxia. Introduction of short interfering RNAs for Pim-1 also resensitizes cancer cells to glucose deprivation under hypoxic conditions, while forced overexpression of Pim-1 causes solid tumor cells to become resistant to glucose deprivation. Moreover, dominant negative Pim-1 reduces tumorigenicity in pancreatic cancer cells and HeLa xenograft mouse models. Together, our studies indicate that Pim-1 plays a distinct role in solid tumor formation in vivo, implying that Pim-1 may be a novel target for cancer therapy.


Figures

Figure 1
Figure 1
Hypoxia induces Pim-1 expression. A: Immunocytochemical staining of Pim-1 proteins in HCT-116 cells cultured under hypoxia or normoxia for 16 hours. B: Immunohistochemical staining of Pim-1 and CA IX in HCT-116 xenografts. Nude mice (n = 5) were inoculated with 5 × 10⁶ HCT-116 cells. Mice were sacrificed and tumors were removed for detection of Pim-1 and CA IX at 21 days post-inoculation. Representative results of the HCT-116 xenografts are shown. C: Western blot analyses of Pim-1 in HCT116, PCI-10, and PCI-43 cells following incubation under hypoxia at the indicated times. D: Western blot analyses of Pim-1, Pim-2, and Pim-3 in 293, HeLa, and PCI-43 cells following incubation under hypoxia or normoxia for 16 hours. N: normoxia, H: hypoxia. The arrowheads indicate the positive signals of Pim-1 or CAIX.
Figure 2
Figure 2
Hypoxia up-regulates Pim-1 and blocks its degradation by the ubiquitin-proteasome pathway. A: Western blot analyses of Pim-1 in PCI-43 cells treated with ALLnL (50 mmol/L) under normoxia for 6 hours. B: Western blot analyses for Pim-1 half-life studies. 293 cells were transfected with FLAG-Pim-1 for 48 hours and were then treated with cycloheximide at the indicated times under normoxia or hypoxia. After transfection of FLAG-Pim-1, the cells were treated with 2μmol/L geldanamycin for 4 hours to test the half-life of Pim-1 under normoxia or hypoxia. Anti-FLAG antibody was used to detect the expression of transfected Pim-1. The Western blot signal at each time point was measured using a densitometer and the level of Pim-1 at time 0 was set at 100%. The percentages of Pim-1 remaining are indicated graphically. C: PCI-43 cells were pre-treated with a 26S proteasome inhibitor (ALLnL, 50 mmol/L and 100 mmol/L) for 8 hours, and ubiquitinated Pim-1 was detected by immunoprecipitating with ubiquitin antibody followed by immunoblotting with Pim-1 antibody. D: 293 cells were co-transfected with FLAG-Pim-1 and HA-ubiquitin for 24 hours and were then incubated under hypoxia or normoxia for 16 hours. After immunoprecipitation using anti-FLAG M2 beads (Sigma) to pull down Pim-1 proteins, the ubiquitinated Pim-1 proteins were detected using anti-HA antibody.
Figure 3
Figure 3
Hypoxia induces nuclear localization of Pim-1 protein. A: Western blot analysis of Pim-1 in HeLa cells transfected with Pim-1. HeLa cells were transfected with FLAG-Pim-1 for 24 hours and incubated under hypoxic or normoxic conditions for 16 hours. Cells were treated with MG132 for 6 hours before harvesting cells. Anti-FLAG antibody was used to detect the expression of Pim-1 in the whole cell lysate, nuclear lysate, and cytoplasmic lysate. B: Immunofluorescence staining of Pim-1 in normoxia and hypoxia. HeLa cells were transfected with FLAG-Pim-1 for 24 hours and incubated under hypoxia for 16 hours. Cells were treated with MG132 for 6 hours before staining, followed by fixing with anti-FLAG antibody to detect the subcellular localization of Pim-1. Nuclei were stained with PI. C: Immunofluorescence staining of endogenous Pim-1 under normoxia or hypoxia. HeLa cells were incubated with 2 μmol/L geldanamycin under hypoxia for 16 hours. Cells were fixed and stained with anti-Pim-1 antibody to detect the subcellular localization of Pim-1. Nuclei were stained with PI.
Figure 4
Figure 4
Hypoxia promotes transformation of NIH3T3 cells following Pim-1 transfection. A: Pim-1 transfection of NIH3T3 cells in normoxia and hypoxia. NIH3T3 cells were transfected with Pim-1 and selected with G-418 for 2 weeks. Pim-1 antibody was used for the Western blot. N: normoxia, H: hypoxia. Asterisk indicates a non-specific band. B: A representative photograph of the soft-agar colony formation assay (Magnification = original ×40; Scale bar = 20 μm). Selected NIH3T3/Pim-1 cells were seeded in agarose. After culture in either hypoxic or normoxic conditions for 3 weeks, colony numbers exceeding 20 μm in size were counted. C: Mean ± SD colony numbers in three different wells for each condition is shown.
Figure 5
Figure 5
dnPim-1 transfectants sensitize cells to apoptosis induced by glucose-deprivation. Representative results of fluorescence-activated cell sorting (FACS) analysis for three independent experiments are shown. A: Apoptotic analysis of PCI-43 cells cultured in glucose-deprived (16 mg/dL) conditions for 24 and 48 hours in the presence of normoxia or hypoxia. Apoptotic cells were determined by PI and annexin V staining using FACS analysis. B: Mean ± SD apoptotic cell percentages in three different experiments of (A). *P < 0.01 compared with normoxic condition. C: Apoptotic analysis of dnPim-1-transfectants under glucose-deprived conditions for 48 hours in the presence of normoxia or hypoxia. Apoptotic cells were determined as described in (A). D: Mean ± SD apoptotic cell percentages in three independent experiments of (C). *P < 0.01 compared with vector control.
Figure 6
Figure 6
Pim-1 siRNA or Pim-1 overexpression has an impact on glucose-deprivation induced apoptotic response. Representative results of FACS analysis for three independent experiments are shown. A: Expression of Pim-1 proteins in PCI-43 cells treated with Pim-1 siRNAs under normoxia and hypoxia (12 hours). N: normoxia, H: hypoxia. B: Apoptotic analysis of cells treated with Pim-1 siRNAs, followed by glucose deprivation for 48 hours in the presence of normoxia and hypoxia. Apoptotic cells were quantified by PI and annexin V staining via FACS analysis. C: Apoptotic cell percentages in three independent experiments of (B). The error bars represent SD. * indicates significance (P < 0.01). D: Western blot of Pim-1 proteins in PCI-43 Pim-1 transfectants. Anti-FLAG immunoblot is shown. E: Apoptotic analysis of Pim-1 transfectants treated with glucose deprivation for 48 hours under normoxia. Apoptotic cells were quantified as described in (B). F: Apoptotic cell percentages in three independent experiments of (E). The error bars represent SD. *P < 0.01.
Figure 7
Figure 7
Introduction of dominant negative Pim-1 reduces tumorigenicity of pancreatic cancer cells. A: Tumorigenesis analysis of dnPim-1 transfectants. SCID mice (n = 5) were inoculated with 5 × 10⁶ dnPim-1 transfectants or vector transfected control cells. Tumor volume was measured every 3 days post-inoculation (mean ± SD). B: Immunohistochemical staining of tumor tissues for TUNEL and CD31. SCID mice (n = 5) were inoculated with 5 × 10⁶ dnPim-1 transfectants or vector transfected control cells as described in (A). Mice were sacrificed and tumors were removed for detection of apoptosis, and angiogenesis at 9 days post-inoculation. Representative results of the dnPim-1-transfected (dnP2) and vector-transfected tumors are shown. C: Mean ± SD TUNEL positive cell numbers in three different tumor tissues for each group is shown. D: Mean ± SD of microvessel counts in three different tumor tissues for each group. Magnification = original ×200.
Figure 8
Figure 8
Introduction of dominant negative Pim-1 reduces tumorigenicity of HeLa cells by administration of tetracycline. A: Western blot analyses of dnPim-1 in Tet-on dnPim-1-transfectants. Anti-HA antibody was used to detect the expression of tetracycline induced dnPim-1 in HeLa cells. * indicates a non-specific band. B: Growth of Tet-On dnPim-1 transfectants in SCID mice by doxycycline administration. Five mice in each group were inoculated with 5 × 10⁶ tumor cells on Day 0. Doxycycline administration was initiated on Day 4 via drinking water at 2 μg/ml delivering approximately 13 mg/kg/day. Tumor sizes were measured every 3 to 4 days following inoculation. Error bars represent SD. *P < 0.01 compared with dnPim-1/doxycycline(−) control. C: Terminal tumor weights were measured (mean ± SD). *P < 0.01 compared with dnPim-1/doxycycline(−) control. D: Immunohistochemical staining of tumor tissues for TUNEL and CD31. Terminal tumors were removed for detection of apoptosis, and angiogenesis at 21 days after inoculation. Representative results of dnPim-1 and vector-transfected tumors are shown. E: Mean ± SD TUNEL positive cell numbers and microvessel counts in three different tumor tissues for each group. Magnification = original ×200. *P < 0.01.

References

    1. Hanahan D, Folkman J. Patterns and emerging mechanisms of the angiogenic switch during tumorigenesis. Cell. 1996;86:353–364. - PubMed
    1. Graeber TG, Osmanian C, Jacks T, Housman DE, Koch CJ, Lowe SW, Giaccia AJ. Hypoxia-mediated selection of cells with diminished apoptotic potential in solid tumours. Nature. 1996;379:88–91. - PubMed
    1. Cuypers HT, Selten G, Berns A, Geurts van Kessel AH. Assignment of the human homologue of Pim-1, a mouse gene implicated in leukemogenesis, to the pter-q12 region of chromosome 6. Hum Genet. 1986;72:262–265. - PubMed
    1. van Lohuizen M, Verbeek S, Krimpenfort P, Domen J, Saris C, Radaszkiewicz T, Berns A. Predisposition to lymphomagenesis in pim-1 transgenic mice: cooperation with c-myc and N-myc in murine leukemia virus-induced tumors. Cell. 1989;56:673–682. - PubMed
    1. Allen JD, Berns A. Complementation tagging of cooperating oncogenes in knockout mice. Semin Cancer Biol. 1996;7:299–306. - PubMed

Publication types

MeSH terms