. 2009 Jun 16;4(6):e5928.
doi: 10.1371/journal.pone.0005928.

Distinct differences in the expansion and phenotype of TB10.4 specific CD8 and CD4 T cells after infection with Mycobacterium tuberculosis

Affiliations

Distinct differences in the expansion and phenotype of TB10.4 specific CD8 and CD4 T cells after infection with Mycobacterium tuberculosis

Truc Thi Kim Thanh Hoang et al. PLoS One. .

Abstract

Background: Recently we and others have identified CD8 and CD4 T cell epitopes within the highly expressed M. tuberculosis protein TB10.4. This has enabled, for the first time, a comparative study of the dynamics and function of CD4 and CD8 T cells specific for epitopes within the same protein in various stages of TB infection.

Methods and findings: We focused on T cells directed to two epitopes in TB10.4; the MHC class I restricted epitope TB10.4 (3-11) (CD8/10.4 T cells) and the MHC class II restricted epitope TB10.4 (74-88) (CD4/10.4 T cells). CD4/10.4 and CD8/10.4 T cells displayed marked differences in terms of expansion and contraction in a mouse TB model. CD4/10.4 T cells dominated in the early phase of infection whereas CD8/10.4 T cells were expanded after week 16 and reached 5-8 fold higher numbers in the late phase of infection. In the early phase of infection both CD4/10.4 and CD8/10.4 T cells were characterized by 20-25% polyfunctional cells (IL-2(+), IFN-gamma(+), TNF-alpha(+)), but whereas the majority of CD4/10.4 T cells were maintained as polyfunctional T cells throughout infection, CD8/10.4 T cells differentiated almost exclusively into effector cells (IFN-gamma(+), TNF-alpha(+)). Both CD4/10.4 and CD8/10.4 T cells exhibited cytotoxicity in vivo in the early phase of infection, but whereas CD4/10.4 cell mediated cytotoxicity waned during the infection, CD8/10.4 T cells exhibited increasing cytotoxic potential throughout the infection.

Conclusions/significance: Our results show that CD4 and CD8 T cells directed to epitopes in the same antigen differ both in their kinetics and functional characteristics throughout an infection with M. tuberculosis. In addition, the observed strong expansion of CD8 T cells in the late stages of infection could have implications for the development of post exposure vaccines against latent TB.


Conflict of interest statement

Competing Interests: The authors have declared that no competing interests exist.

Figures

Figure 1
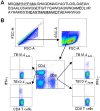
Figure 1. The TB10.4 CD4 and CD8 T cells epitopes that are recognized by CB6F1 mice (BALB/c×C57BL/6).
(A) the amino acid sequence of the TB10.4 protein with the CD4 and CD8 T cell epitopes underlined. (B) Lung lymphocytes from mice infected at week six after aerosol infection were stimulated in vitro with either the TB10.4 3–11 (QIMYNYPAM) or the TB10.4 74–88 (THEANTMAMMARDT) for 6 hours before being assessed for IFN-γ production by flow cytometry. A gating sequence was applied to the data to determine the frequencies of IFN-γ positive CD4 and CD8 T cells. The rationale for the FSC-H vs. FSC-A gating is to capture only singlet particles and eliminate doublets that may occur as a result of e.g. cells sticking together.
Figure 2
Figure 2. The bacterial load in the lungs throughout infection shown as Log10 CFU.
Mice were challenged by the aerosol route with virulent M. tuberculosis. At the indicated timepoints 3–6 mice were killed and the bacterial burden (CFU) was measured in the lung.
Figure 3
Figure 3. The kinetics of CD4/10.4 and CD8/10.4 following aerosol infection with M.tb.
(A and B) CB6F1 mice were infected by the aerosol route with virulent M.tb Erdman and lymphocytes were obtained from lungs or blood and then stimulated with TB10.4 3–11 or TB10.4 74–88 for assessment of IFN-γ production by FACS analysis. Frequencies represent IFN-γ production out of total T cells. Background staining from cells stimulated with medium alone has been deducted (Background <0.5%). Each time point represents the mean from at least three individual mice±standard error of the mean (SEM). (C) Lung or blood cells were stained directly ex vivo with H2-Kb pentamer loaded with IMYNYPAM. Background staining from naïve mice has been deducted. Each time point consists of data from a pool of 3–6 mice. (**p<0.01, Student's t-test).
Figure 4
Figure 4. Phenotypic analysis of CD4/10.4 and CD8/10.4 during a persistent infection.
Lung lymphocytes from mice sacrificed at different stages of infection (Early: week 6; late: week 40) were stimulated with (A) TB10.4 3–11 or (B) TB10.4 74–88 prior to staining for the surface markers CD44, CD11a and intracellularly for IFN-γ. Samples were then examined by flow cytometry. FACS plots are shown for one mouse, representative of 3–4 mice.
Figure 5
Figure 5. Changes in cytokine profiles of CD4/10.4 and CD8/10.4 T cells during a chronic infection.
Cells from infected lungs were stimulated with TB10.4 3–11 or TB10.4 74–88 prior to staining with anti-CD4, -CD8, -IFN-γ, -TNF-α and –IL-2. (A) Cytokine profiles of CD4/10.4 was determined by first dividing the CD4 T cells into IFN-γ positive (+) or IFN-γ negative (−) cells. Both the IFN-γ+ and IFN-γ- cells were analyzed with respect to the production of TNF-α and IL-2. The numbers in the quadrant gates of the plots denominates each distinct population based on their cytokine production and is color coded as shown. To illustrate the gating sequence two examples from a late infection stage are shown. (B and C). The pie-charts illustrate the relative contribution of the different cytokine T cell populations to the total CD4/10.4 population and data is depicted for both an early and a late time point, for 3 mice at each time point. Background (>0.5%) has been deducted. (D) The proportion of IFN-γ+ TNF-α+ IL-2+ within the CD4/10.4 or CD8/10.4 T cells populations in the early stage compared to the late stage of infection.
Figure 6
Figure 6. Functional characterization of the CD4/10.4 and CD8/10.4 T cells at different stages of infection.
(Early: week 6; Intermediate: week 16, late: week 40) (A and B) Lung cells from infected mice were stimulated in vitro with TB10.4 3–11 or TB10.4 74–88 (lower panel) or left non stimulated (“Media”, upper panel) in the presence of αCD107a/b and stained with αIFN-γ and αCD8 (A), or αCD4 (B), antibodies (C) CD107a/b MFI of the IFN-γ positive cells following in vitro stimulation with TB10.4 3–11 or TB10.4 74–88. (D) The specific lysis of TB10.4 3–11 or TB10.4 74–88 loaded cells was determined in an in vivo cytotoxicity assay. Unloaded splenocytes (CFSElow) and TB10.4 3–11 or TB10.4 74–88 loaded splenocytes (CFSEhigh) from naïve mice were transferred into infected mice. The amount of splenocytes killed in vivo by cytotoxic T cells specific for either TB10.4 3–11 or TB10.4 74–88 was observed as a reduction in the CFSEhigh population and a percent specific lysis was calculated. A value of P<0.05 (students paired t-test) was considered significant and is shown by *.

References

    1. Lazarevic V, Nolt D, Flynn JL. Long-term control of Mycobacterium tuberculosis infection is mediated by dynamic immune responses. J Immunol. 2005;175:1107–1117. - PubMed
    1. van Pinxteren L, Cassidy JP, Smedegaard BHC, Agger EM, Andersen P. Control of latent Mycobacterium tuberculosis infection is dependent on CD8 T cells. Eur J Immunol. 2000;30:3689–3698. - PubMed
    1. Billeskov R, Vingsbo-Lundberg C, Andersen P, Dietrich J. Induction of CD8 T cells against a novel epitope in TB10.4: correlation with mycobacterial virulence and the presence of a functional region of difference-1. J Immunol. 2007;179:3973–3981. - PubMed
    1. Majlessi L, Rojas MJ, Brodin P, Leclerc C. CD8+-T-cell responses of Mycobacterium-infected mice to a newly identified major histocompatibility complex class I-restricted epitope shared by proteins of the ESAT-6 family. Infect Immun. 2003;71:7173–7177. - PMC - PubMed
    1. Kamath AB, Woodworth J, Xiong X, Taylor C, Weng Y, et al. Cytolytic CD8+ T cells recognizing CFP10 are recruited to the lung after Mycobacterium tuberculosis infection. J Exp Med. 2004;200:1479–1489. - PMC - PubMed

Publication types

Substances