. 2009 Jan;2(1):166-82.
doi: 10.1093/mp/ssn086. Epub 2008 Dec 16.

A light-independent allele of phytochrome B faithfully recapitulates photomorphogenic transcriptional networks

Affiliations

A light-independent allele of phytochrome B faithfully recapitulates photomorphogenic transcriptional networks

Wei Hu et al. Mol Plant. 2009 Jan.

Erratum in

  • Mol Plant. 2015 Mar;8(3):493

Abstract

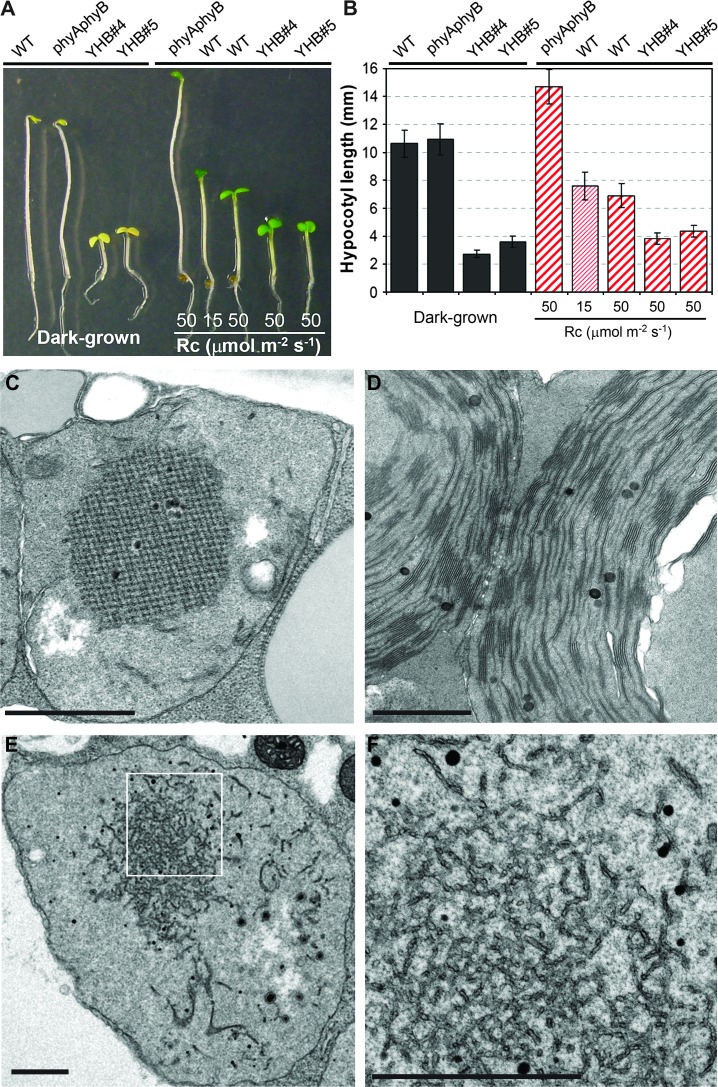
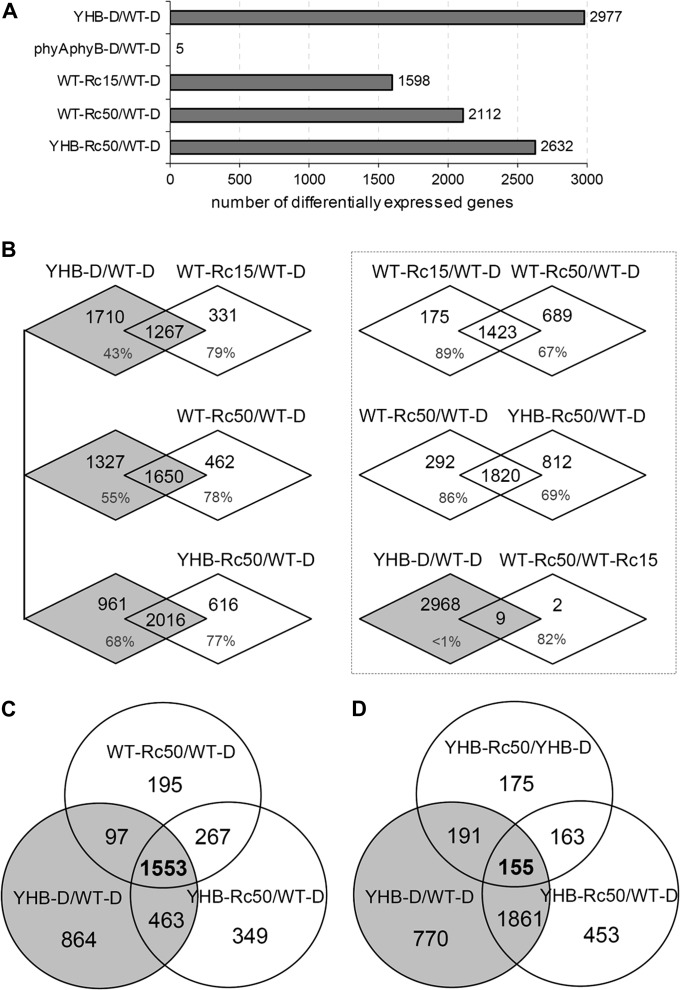
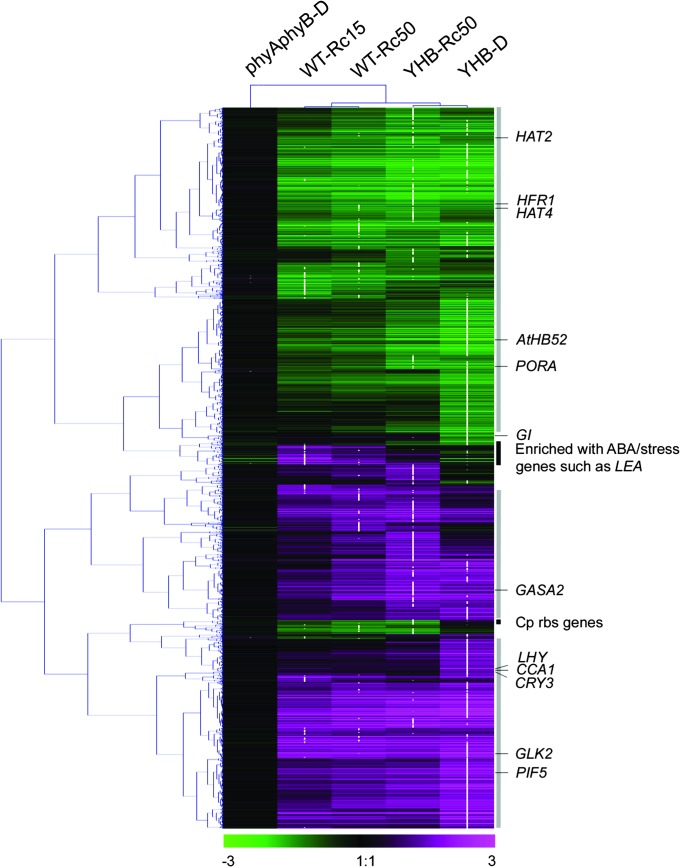
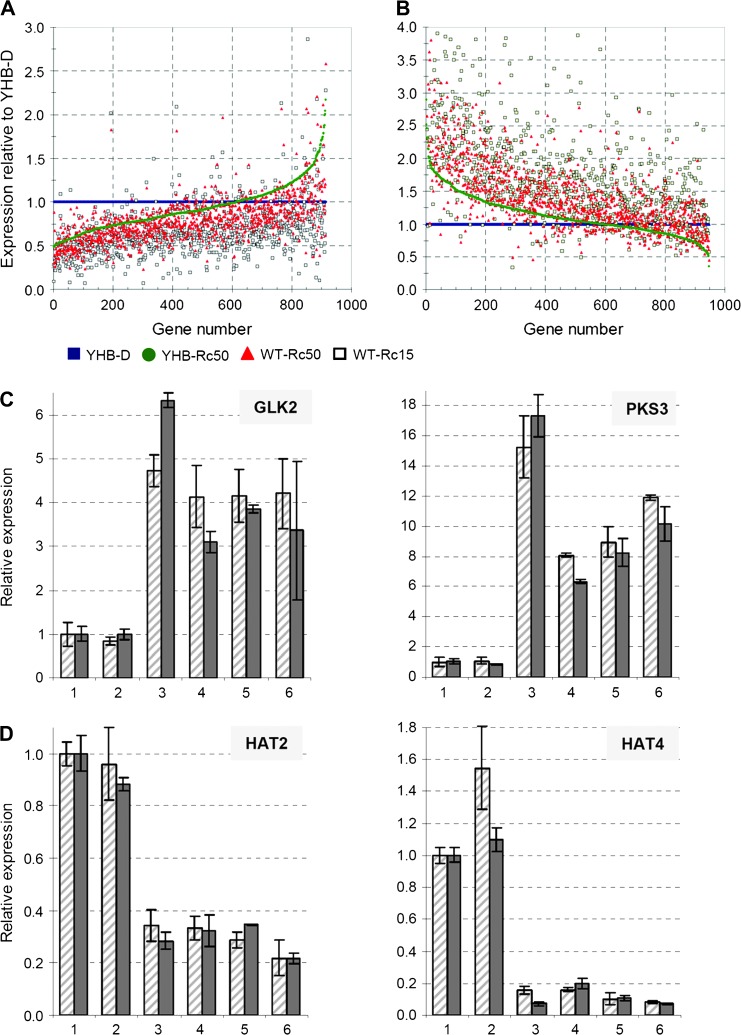
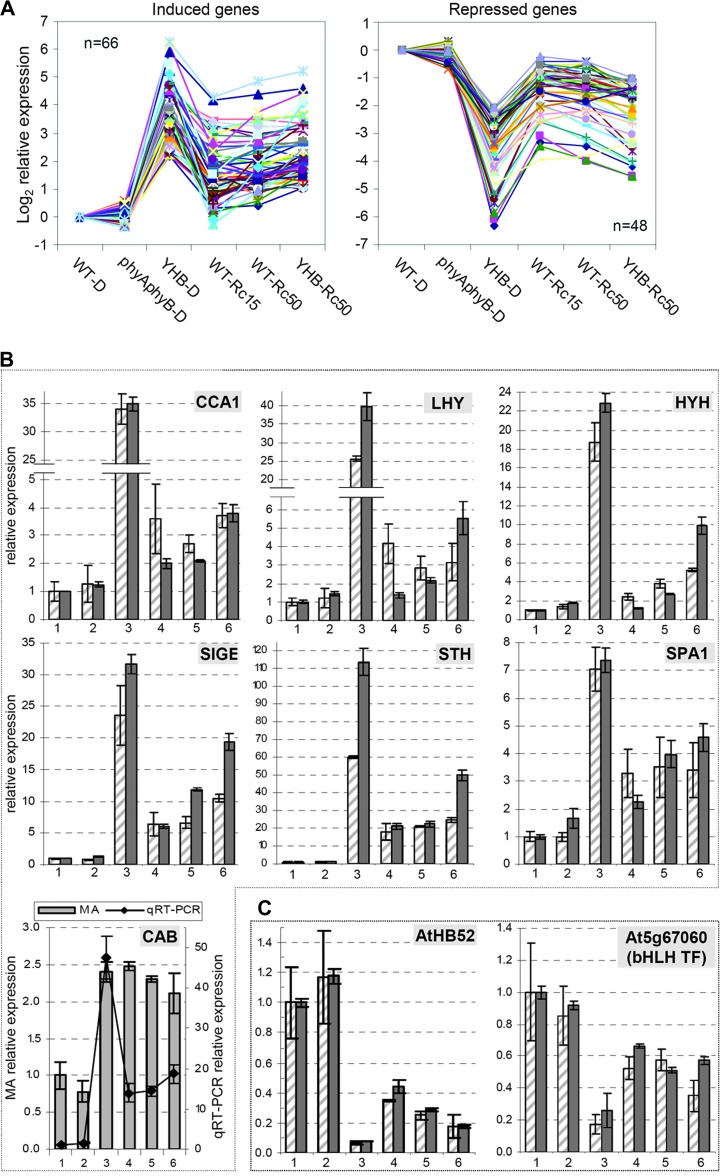
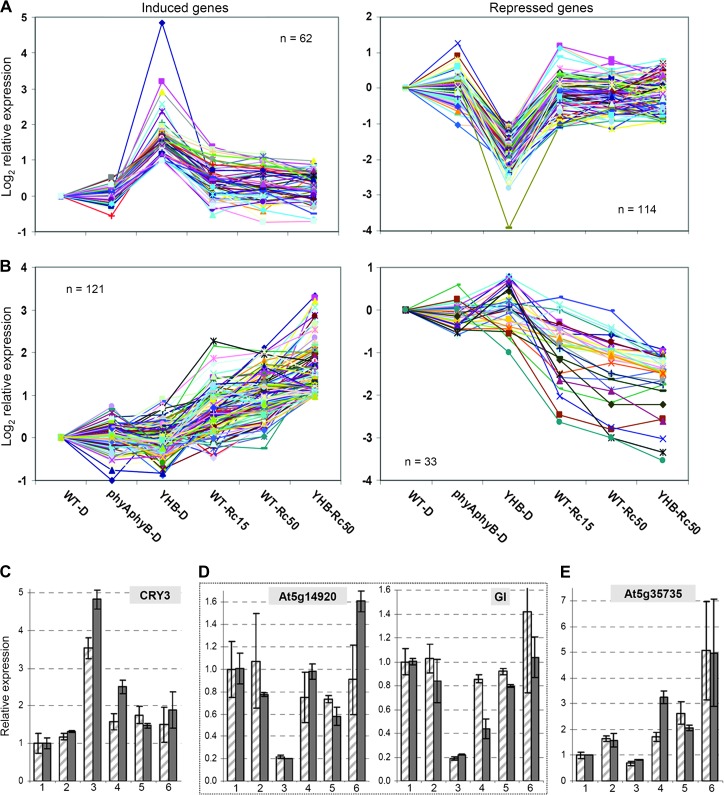
Dominant gain-of-function alleles of Arabidopsis phytochrome B were recently shown to confer light-independent, constitutive photomorphogenic (cop) phenotypes to transgenic plants (Su and Lagarias, 2007). In the present study, comparative transcription profiling experiments were performed to assess whether the pattern of gene expression regulated by these alleles accurately reflects the process of photomorphogenesis in wild-type Arabidopsis. Whole-genome transcription profiles of dark-grown phyAphyB seedlings expressing the Y276H mutant of phyB (YHB) revealed that YHB reprograms about 13% of the Arabidopsis transcriptome in a light-independent manner. The YHB-regulated transcriptome proved qualitatively similar to but quantitatively greater than those of wild-type seedlings grown under 15 or 50 micromol m(-2) m(-1) continuous red light (Rc). Among the 2977 genes statistically significant two-fold (SSTF) regulated by YHB in the absence of light include those encoding components of the photosynthetic apparatus, tetrapyrrole/pigment biosynthetic pathways, and early light-responsive signaling factors. Approximately 80% of genes SSTF regulated by Rc were also YHB-regulated. Expression of a notable subset of 346 YHB-regulated genes proved to be strongly attenuated by Rc, indicating compensating regulation by phyC-E and/or other Rc-dependent processes. Since the majority of these 346 genes are regulated by the circadian clock, these results suggest that phyA- and phyB-independent light signaling pathway(s) strongly influence clock output. Together with the unique plastid morphology of dark-grown YHB seedlings, these analyses indicate that the YHB mutant induces constitutive photomorphogenesis via faithful reconstruction of phyB signaling pathways in a light-independent fashion.

Keywords: Arabidopsis; light signaling; photomorphogenesis; phytochrome; signal transduction; transcriptome analysis.


Figures

Figure 1.
Figure 1.
Constitutive Photomorphogenic Phenotype of YHB Seedlings. (A) Morphology comparison of 4-day-old seedlings grown in darkness or under different fluence rates of continuous red light (Rc). (B) Hypocotyl lengths (mean ± S.D.) of 4-day-old seedlings of different genotypes (n  =  40∼60). (C–F) TEM micrographs of an etioplast of dark-grown wild type (C), of a chloroplast of light-grown wild type (D), and of an etioplast from dark-grown YHB seedlings ((E) and (F); (F) is a close-up view of (E)). Scale bars  =  1.0 μm.
Figure 2.
Figure 2.
Microarray Analysis Shows Significant Misregulation of the Arabidopsis Genome by YHB. (A) Number of statistically significant two-fold (SSTF) regulated genes in dark-grown YHB (YHB–D), in dark-grown phyAphyB double mutants (phyAphyB–D), in Ler wild type grown under 15 μmol m−2 s−1 (WT–Rc15) or 50 μmol m−2 s−1 (WT–Rc50), and in YHB grown under 50 μmol m−2 s−1 (YHB–Rc50) compared with dark-grown Ler wild type (WT–D). (B) Venn diagrams show pairwise comparison of SSTF-regulated genes with percentage values indicating the proportion of shared genes for each expression profile. (C, D) Venn diagrams show comparison among three different sets of SSTF-regulated genes.
Figure 3.
Figure 3.
Hierarchical Cluster Analysis of 3889 Core YHB- and Rc-Regulated Genes Reveals Great Overlap of Expression Pattern. White dots indicate absolute maximum of expression change for each gene among the five experimental treatments described in Figure 2. Vertical gray bars at the right side mark gene sets with similar trend of expression change between YHB–D and Rc-grown seedlings. Solid black bars illustrate two gene sets differentially regulated by YHB and Rc. Some representative genes are indicated in the map. The numerical values for the green-to-magenta gradient bar (bottom) represent log2-fold change relative to WT–D, with induction represented in magenta and repression represented in green.
Figure 4.
Figure 4.
YHB-Dependent Misregulation of Gene Expression Is Globally Attenuated by Red Light. Among the total of 1861 genes with comparative expression changes in both dark- and Rc-grown YHB seedlings, (A) 914 genes showed significant up-regulation, while (B) 947 genes showed significant down-regulation; expression for four experimental treatments was normalized to YHB–D and sorted by YHB–Rc50. Expression validation of two representative YHB-induced genes (C) and two representative YHB-repressed genes (D) are shown. Slashed bars  =  microarray measurement; solid bars  =  qRT–PCR measurement. Treatment codes include: 1  =  WT–D, 2  =  phyAphyB–D, 3  =  YHB–D, 4  =  WT–Rc15, 5  =  WT–Rc50, and 6  =  YHB–Rc50.
Figure 5.
Figure 5.
Class-1 YHB-Regulated Genes Show a Striking Pattern of Attenuation by Red Light. (A) Integrated expression patterns of YHB-induced and repressed genes that were attenuated by Rc (see Supplemental Table 4 for list of genes shown). Expression validation of seven representative YHB-induced genes (B) and two representative YHB-repressed genes (C) are shown. CAB gene expression is inconsistent between two measurements and thus is plotted with two axes. The legend for the relative expression in (B) and (C) is same as Figure 4C and 4D.
Figure 6.
Figure 6.
Class-2 YHB-Regulated Genes Show Almost Complete Attenuation by Red Light while Expression of Class-3 Red Light-Regulated Genes Is YHB-Independent. (A) Integrated induced and repressed expression patterns for Class-2 genes (see Supplemental Table 4 for list of genes shown). (B) Integrated induced and repressed expression patterns for Class-3 genes (see Supplemental Table 4 for list of genes shown). (C–E) Expression validation of one YHB–D-induced gene (C), two YHB–D repressed genes (D), and one Rc-specific induced gene (E). The legend for the relative expression in (C)–(E) is the same as in Figure 4C and 4D.

References

    1. Al-Sady B, Kikis EA, Monte E, Quail PH. Mechanistic duality of transcription factor function in phytochrome signaling. Proc. Natl Acad. Sci. U S A. 2008;105:2232–2237. - PMC - PubMed
    1. Al-Sady B, Ni W, Kircher S, Schafer E, Quail PH. Photoactivated phytochrome induces rapid PIF3 phosphorylation prior to proteasome-mediated degradation. Mol. Cell. 2006;23:439–446. - PubMed
    1. Alabadi D, Yanovsky MJ, Mas P, Harmer SL, Kay SA. Critical role for CCA1 and LHY in maintaining circadian rhythmicity in Arabidopsis . Curr. Biol. 2002;12:757–761. - PubMed
    1. Bae G, Choi G. Decoding of light signals by plant phytochromes and their interacting proteins. Ann. Rev. Plant Biol. 2008;59:281–311. - PubMed
    1. Chen M, Chory J, Fankhauser C. Light signal transduction in higher plants. Ann. Rev. Genet. 2004;38:87–117. - PubMed

Publication types