

Reconstructing three-dimensional shape envelopes from time-resolved small-angle X-ray scattering data
- PMID: 19529835
- PMCID: PMC2648657
- DOI: 10.1107/S0021889808028264
Reconstructing three-dimensional shape envelopes from time-resolved small-angle X-ray scattering data
Abstract
Modern computing power has made it possible to reconstruct low-resolution, three-dimensional shapes from solution small-angle X-ray scattering (SAXS) data on biomolecules without a priori knowledge of the structure. In conjunction with rapid mixing techniques, SAXS has been applied to time resolve conformational changes accompanying important biological processes, such as biomolecular folding. In response to the widespread interest in SAXS reconstructions, their value in conjunction with such time-resolved data has been examined. The group I intron from Tetrahymena thermophila and its P4-P6 subdomain are ideal model systems for investigation owing to extensive previous studies, including crystal structures. The goal of this paper is to assay the quality of reconstructions from time-resolved data given the sacrifice in signal-to-noise required to obtain sharp time resolution.
Figures
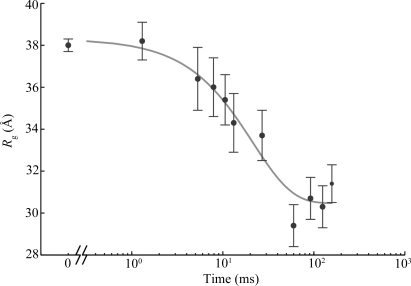
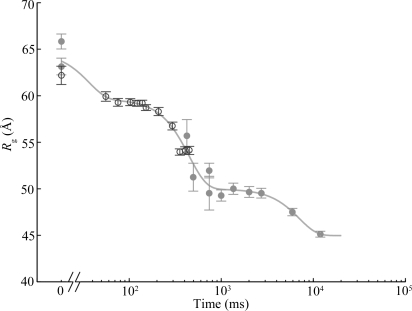
 ) versus time for the P4–P6 subdomain. The points are calculated from fits to the Guinier region of the data (Guinier & Fournet, 1955 ▶), with the errors being determined by the 95% confidence intervals. The black line is the fit of the equation
 with
with  ,
,  and
and  ms. When measured by SAXS, P4–P6 folding is accurately described by a single exponential; thus the global compaction of P4–P6 is apparently a two-state process.
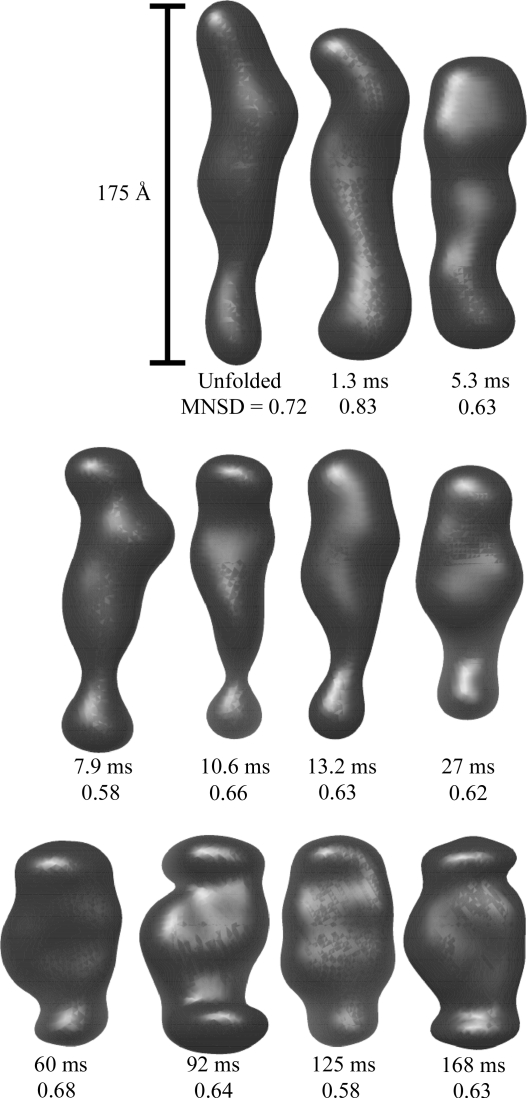
 =
= 
 +
+  +
+  +
+  , where
  ,
,  ,
,  ,
,  ,
,  ms,
ms,  ms and
  ms. Radius of gyration versus time for the Tetrahymena ribozyme shows two long-lived intermediates on the folding pathway. Open circles correspond to data points acquired at the APS with the continuous-flow mixer; filled circles represent data collected with a stopped-flow mixer at CHESS.
 versus time.
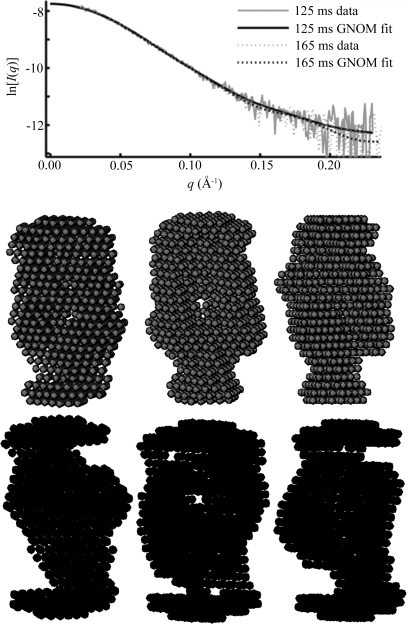
 region, despite the underlying data being nearly identical within the noise. Below are three individual reconstructions each for the 125 ms (upper) and 168 ms (lower) data. Although there is variation between the models reconstructed from a single curve, the variation is greater between the top and bottom sets of models. This is also reflected quantitatively in the MNSD, which is 0.58 and 0.63 for the 125 and 168 ms points, respectively, but 0.69 between shapes from the different reconstructions, slightly higher. Thus, in spite of the overall similarity in the data, models at these two time points reconstruct to slightly different shapes.
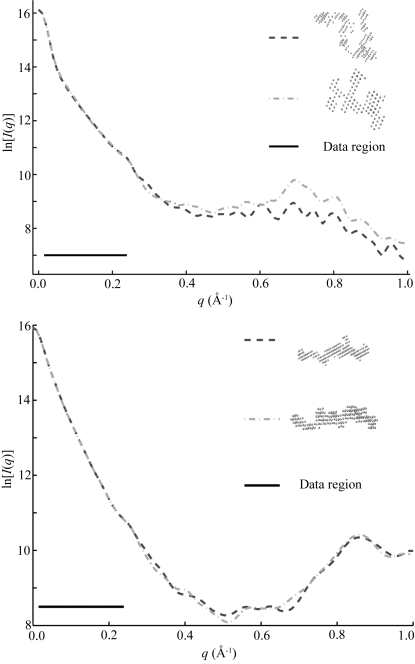
 Å
Å to
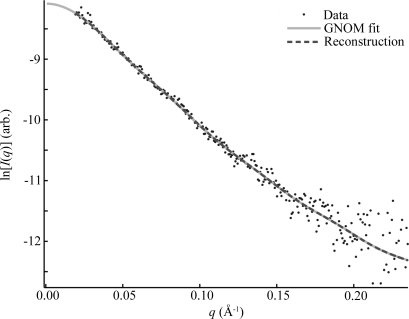
to  Å. Top: Although these reconstructed models for the full-length ribozyme are very different, we note that the scattering profiles of both of these models agree well with our measurements (data not shown) and with each other within the data range. Discrepancies that are evident outside of the scattering regime might indicate there is more information to gather at larger . Bottom: For P4–P6 reconstructions the agreement is excellent both within and beyond the data range.
References
-
- Cate, J. H., Gooding, A. R., Podell, E., Zhou, K. H., Golden, B. L., Kundrot, C. E., Cech, T. R. & Doudna, J. A. (1996). Science, 273, 1678–1685. - PubMed
-
- Chacón, P., Díaz, J. F., Morán, F. & Andreu, J. M. (2000). J. Mol. Biol.299, 1289–1302. - PubMed
-
- Chen, L., Hodgson, K. O. & Doniach, S. (1996). J. Mol. Biol.261, 658–671. - PubMed
-
- Das, R., Kwok, L. W., Millett, I. S., Bai, Y., Mills, T. T., Jacob, J., Maskel, G. S., Seifert, S., Mochrie, S. G. J., Thiyagarajan, P., Doniach, S., Pollack, L. & Herschlag, D. (2003). J. Mol. Biol.332, 311–319. - PubMed
Grants and funding
LinkOut - more resources
Full Text Sources
Research Materials