. 2009 Aug;37(15):4987-5000.
doi: 10.1093/nar/gkp426. Epub 2009 Jun 16.

Transcripts of unknown function in multiple-signaling pathways involved in human stem cell differentiation

Affiliations

Transcripts of unknown function in multiple-signaling pathways involved in human stem cell differentiation

Kunio Kikuchi et al. Nucleic Acids Res. 2009 Aug.

Abstract

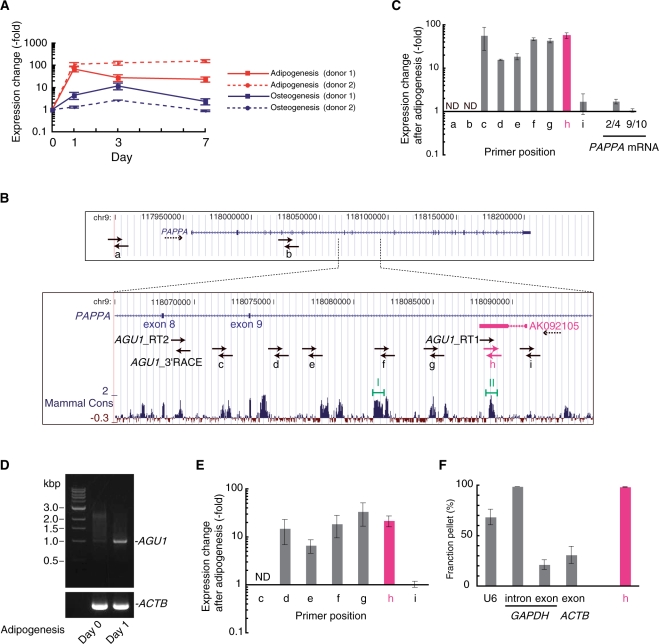
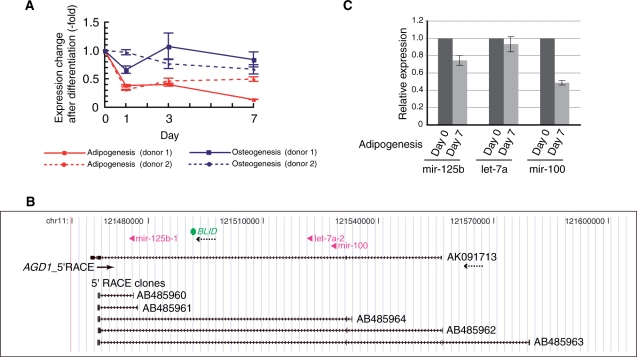
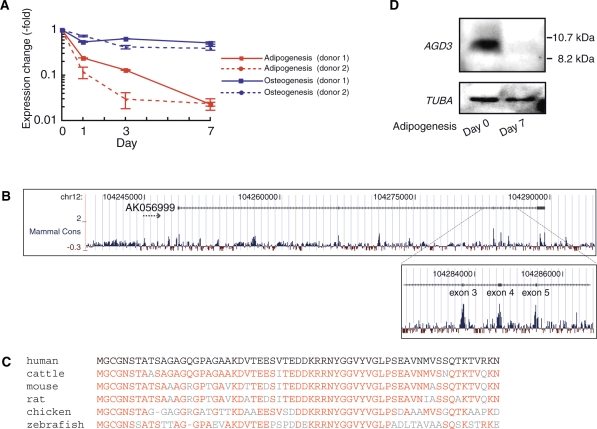
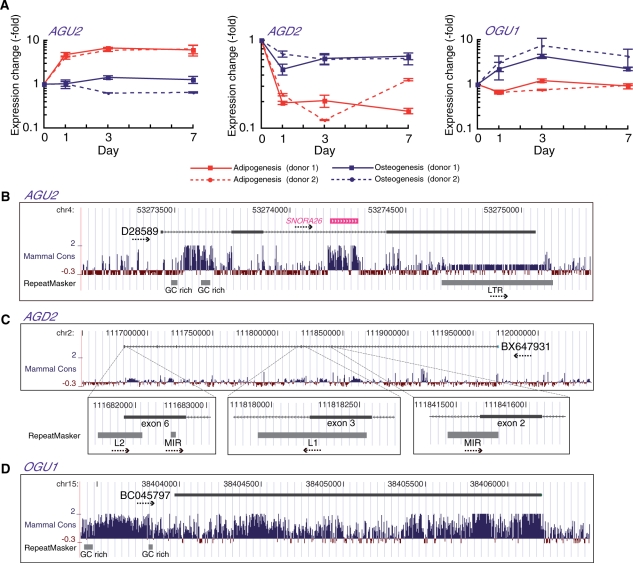
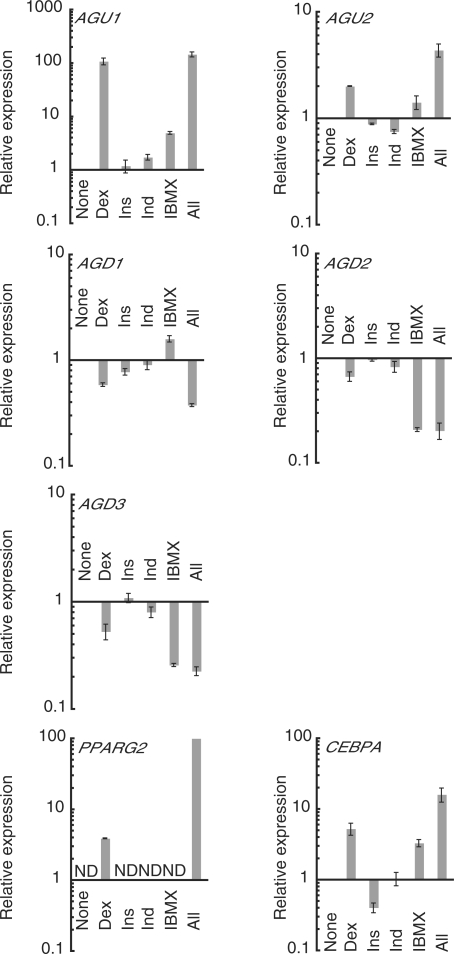
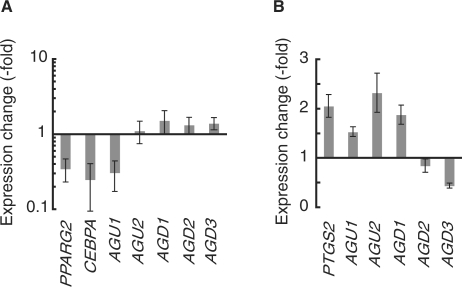
Mammalian transcriptome analysis has uncovered tens of thousands of novel transcripts of unknown function (TUFs). Classical and recent examples suggest that the majority of TUFs may underlie vital intracellular functions as non-coding RNAs because of their low coding potentials. However, only a portion of TUFs have been studied to date, and the functional significance of TUFs remains mostly uncharacterized. To increase the repertoire of functional TUFs, we screened for TUFs whose expression is controlled during differentiation of pluripotent human mesenchymal stem cells (hMSCs). The resulting six TUFs, named transcripts related to hMSC differentiation (TMDs), displayed distinct transcriptional kinetics during hMSC adipogenesis and/or osteogenesis. Structural and comparative genomic characterization suggested a wide variety of biologically active structures of these TMDs, including a long nuclear non-coding RNA, a microRNA host gene and a novel small protein gene. Moreover, the transcriptional response to established pathway activators indicated that most of these TMDs were transcriptionally regulated by each of the two key pathways for hMSC differentiation: the Wnt and protein kinase A (PKA) signaling pathways. The present study suggests that not only TMDs but also other human TUFs may in general participate in vital cellular functions with different molecular mechanisms.


Figures

Figure 1.
Figure 1.
Structural characterization of the AGU1 locus and transcripts. (A) Expression change in AGU1 during the first 7 days of adipogenesis or osteogenesis from two different hMSC donors. The RNA levels were measured with real-time RT–PCR and normalized to 18S rRNA. Error bars show the standard deviations. (B) Schematic drawing showing two transcription units in the AGU1 locus, an AGU1 representative EST (AK092105) and PAPPA (pregnancy-associated plasma protein A) in the format of the UCSC Human Genome Browser. The transcriptional directions are denoted by dotted arrows. Solid arrows, which are out of scale, indicate the locations and orientations of primers used for reverse transcription, real-time PCR and 3′RACE. At the bottom, the level of sequence conservation among the mammalian species (Mammal Cons) is indicated (31). Two highly conserved regions (I and II) were predicted to fold into stable secondary structures (see Supplementary Figure S5). (C) Changes in transcriptional levels at nine different locations (a–i), shown in (B), and at two different locations on PAPPA mRNA (exons 2−4 and exons 9−10) were measured using real-time RT–PCR 24 h after hMSC adipogenic induction. cDNA was prepared by reverse transcription of total RNA with both random and oligo(dT) primers. Data were normalized to 18S rRNA abundance. Error bars show standard deviations. ND, not detected. (D) Agarose gel electrophoresis of 3′RACE products of AGU1 and ACTB (β-actin). The ∼1.0 kb band appeared only on Day 1 after adipogenic induction, and was confirmed to be derived from the AGU1 locus by sequencing (see Supplementary Figure S4). (E) AGU1-specific real-time RT–PCR. Transcriptional changes at seven different locations (c–i) 24 h after hMSC adipogenic induction were measured with cDNA prepared by reverse transcription of polyA+ RNA and AGU1_RT 2 primer. Data were normalized to GAPDH mRNA expression. Error bars show standard deviations. ND, not detected. (F) Cell fractionation analysis of AGU1 RNA. As controls, spliceosomal U6 snRNA and GAPDH intronic RNA were found in the pellet, whereas mRNAs of ACTB and GAPDH were in the supernatant. Error bars show standard deviations.
Figure 2.
Figure 2.
Structural characterization of a microRNA host gene, AGD1. (A) Changes in expression of an AGD1 representative EST (AK091713) during the first 7 days of adipogenesis or osteogenesis in hMSCs from two different donors. RNA levels were measured by real-time RT–PCR and normalized to 18S rRNA. Error bars show standard deviations. (B) Genomic context of the AGD1 locus. A modified image from the UCSC Human Genome Browser showing an AGD1 representative EST (AK091713), BLID (BH3-like motif containing, cell death inducer), three intronic microRNAs (mir-125b, let-7a and mir-100) and the five different 5′RACE clones obtained in this study. The solid arrow and arrowheads, which are both out of scale, denote the position and orientation of the AGD1-specific PCR primer for 5′RACE (AGD1_5′RACE) and microRNAs, respectively. Dotted arrows indicate orientations of the transcripts. (C) TaqMan real-time RT–PCR measurement of the mature microRNAs before and after 7 days of adipogenic induction. Error bars show standard deviations.
Figure 3.
Figure 3.
Structural characterization of a novel small protein gene, AGD3. (A) Real-time RT–PCR measurement of AGD3 transcription level during the first 7 days of adipogenesis or osteogenesis in hMSCs from two different donors. RNA levels were normalized to 18S rRNA. Error bars show standard deviations. (B) Schematic drawing showing mammalian conservation of the nucleotide sequence in the AGD3 locus from the UCSC Human Genome Browser. (C) An alignment of amino-acid sequences of AGD3 vertebrate orthologs: human: NP_001138671, cattle: NP_001138674, mouse: NP_001138670, rat: EDM17086, chicken: NP_001138672, zebrafish: XP_001922116. Note that only the zebrafish ortholog contains an additional 30 amino-acid residues at the N terminus of the shown homologous sequences and that for all the others, the full-length sequences are shown. Residues identical to the human AGD3 amino acid are shown in red letters. (D) Western blotting analysis of the reduction in AGD3 protein after adipogenic induction. TUBA (tubulin, alpha) was chosen as an internal loading control.
Figure 4.
Figure 4.
Structural characterization of AGU2, AGD2 and OGU1. (A) Real-time RT–PCR measurement of AGU2, AGD2 and OGU1 during the first 7 days of adipogenesis or osteogenesis from two different hMSC donors. RNA levels were normalized to 18S rRNA. Error bars show standard deviations. (B–D) Modified views of the UCSC Human Genome Browser showing the genomic context of the AGU2, AGD2 and OGU1 loci. Exon–intron structures of representative ESTs of AGU2 (D28589), AGD2 (BX647931) and OGU1 (BC045797) are shown. Nucleotide sequence conservation and locations of genomic repeats are shown (31,43). The direction of transcripts and repeats are indicated by dotted arrows.
Figure 5.
Figure 5.
Effects of the individual adipogenesis-inducing reagents upon TMD expression changes during adipogenesis. Relative expression changes of adipogenesis-related TMDs and two master transcription factors (PPARG2 and CEBPA) after 24 h treatment with none, each, or all of the four adipogenesis-inducing reagents (dexamethasone, Dex; insulin, Ins; indomethacin, Ind; isobutylmethylxanthine, IBMX) were quantified by real-time RT–PCR. For the TMDs and CEBPA, expression levels induced by any of the reagents are indicated relative to those in hMSCs that were treated with none of the adipogenesis-inducing reagents (None). Because PPARG2 showed a detectable expression level only with Dex and all four reagents, the former expression level (Dex) is indicated relative to the latter one (All), which is normalized to 100. ND, not detected. See Table S1 for primer sequences. Error bars show standard deviations.
Figure 6.
Figure 6.
Dissection of upstream-signaling pathways regulating TMD transcription. (A) TMD expression changes by Wnt activation. Expression levels of all the adipogenesis-related TMDs and Wnt target genes (PPARG2 and CEBPA) were measured using real-time RT–PCR 24 h after adipogenic induction in the absence or presence of Wnt3A (150 ng/ml). The log ratio of the individual TMD expression with versus without Wnt3A is shown on the y-axis. (B) TMD expression changes by PKA activation. Expression levels of all the adipogenesis-related TMDs and a PKA target gene (PTGS2) were measured using real-time RT–PCR after 7-day treatment of hMSCs with forskolin (50 μM) or vehicle control (dimethyl sulfoxide). The ratio of the individual TMD expression with versus without forskolin is shown on the y-axis. See Table S1 for primer sequences. Error bars show standard deviations.

Similar articles

Cited by

References

    1. Carninci P., Kasukawa T., Katayama S., Gough J., Frith M.C., Maeda N., Oyama R., Ravasi T., Lenhard B., Wells C., et al. The transcriptional landscape of the mammalian genome. Science. 2005;309:1559–1563. - PubMed
    1. Cheng J., Kapranov P., Drenkow J., Dike S., Brubaker S., Patel S., Long J., Stern D., Tammana H., Helt G., et al. Transcriptional maps of 10 human chromosomes at 5-nucleotide resolution. Science. 2005;308:1149–1154. - PubMed
    1. Bertone P., Stolc V., Royce T.E., Rozowsky J.S., Urban A.E., Zhu X., Rinn J.L., Tongprasit W., Samanta M., Weissman S., et al. Global identification of human transcribed sequences with genome tiling arrays. Science. 2004;306:2242–2246. - PubMed
    1. Kapranov P., Willingham A.T., Gingeras T.R. Genome-wide transcription and the implications for genomic organization. Nat. Rev. Genet. 2007;8:413–423. - PubMed
    1. Willingham A.T., Gingeras T.R. TUF love for ‘junk’ DNA. Cell. 2006;125:1215–1220. - PubMed

Publication types