. 2009 Sep;17(9):1626-36.
doi: 10.1038/mt.2009.111. Epub 2009 Jun 16.

Attraction and activation of dendritic cells at the site of tumor elicits potent antitumor immunity

Affiliations

Attraction and activation of dendritic cells at the site of tumor elicits potent antitumor immunity

Natalia Lapteva et al. Mol Ther. 2009 Sep.

Abstract

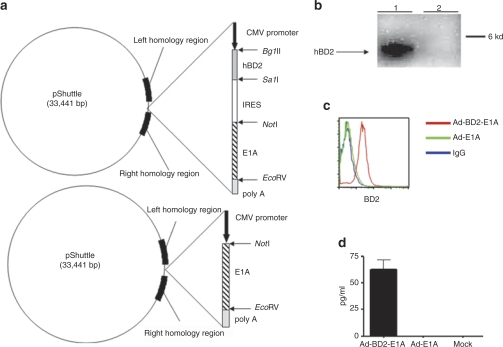
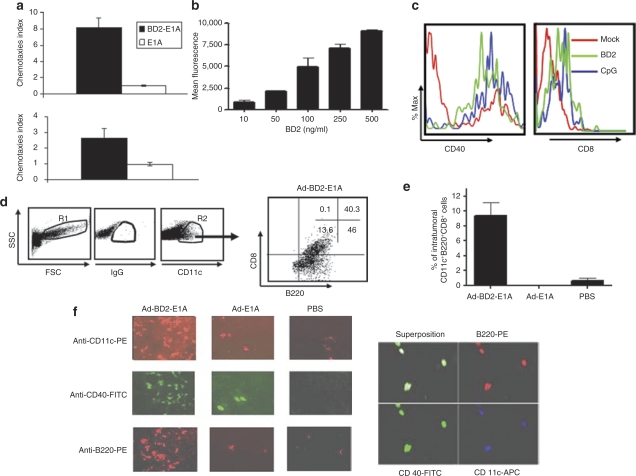
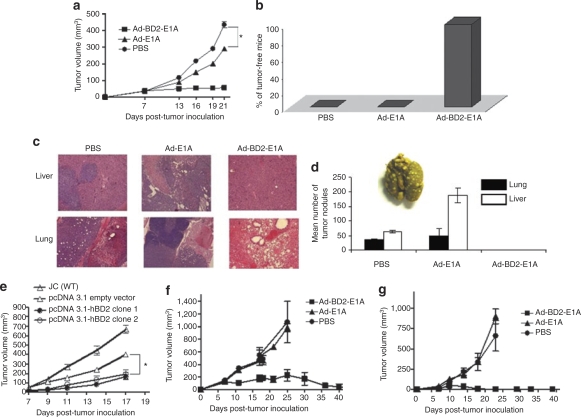
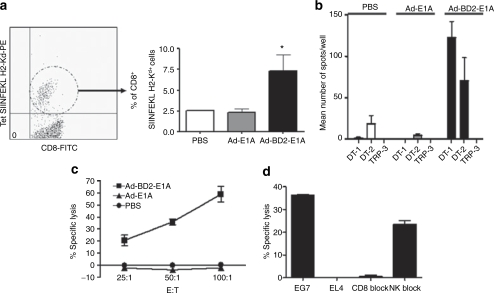
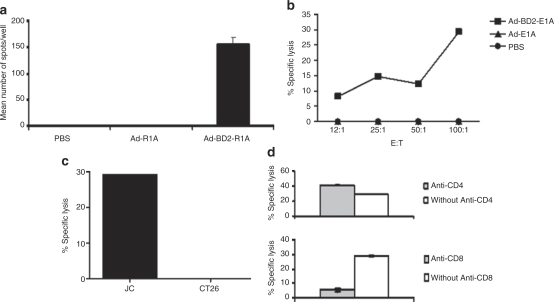
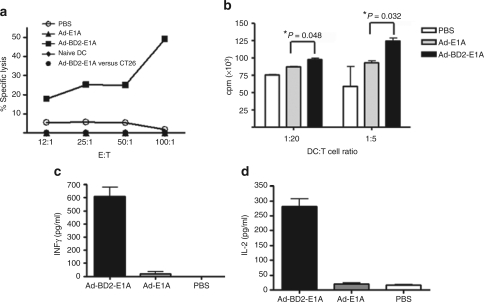
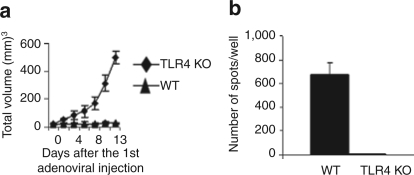
Tumor cells harbor unique genetic mutations, which lead to the generation of immunologically foreign antigenic peptide repertoire with the potential to induce individual tumor-specific immune responses. Here, we developed an in situ tumor vaccine with the ability to elicit antitumor immunity. This vaccine comprised an E1B-deleted oncolytic adenovirus expressing beta-defensin-2 (Ad-BD2-E1A) for releasing tumor antigens, recruiting and activating plasmacytoid dendritic cells (pDCs). Intratumoral injections of Ad-BD2-E1A vaccine inhibited primary breast tumor growth and blocked naturally occurring metastasis in mice. Ad-BD2-E1A vaccination induced potent tumor-specific T-cell responses. Splenic and intratumoral DCs isolated from Ad-BD2-E1A-immunized mice were able to stimulate or promote the differentiation of naive T cells into tumor-specific cytotoxic T cells. We further found that the increased numbers of mature CD45RA(+)CD8alpha(+)CD40(+) pDCs infiltrated into Ad-BD2-E1A-treated tumors. The antitumor effect of Ad-BD2-E1A vaccination was abrogated in toll-like receptor 4 (TLR4) deficient mice, suggesting the critical role of TLR4 in the induction of antitumor immunity by Ad-BD2-E1A. The results of this study indicate that in situ vaccination with the oncolytic BD2-expressing adenovirus preferentially attracts pDCs and promotes their maturation, and thus elicits potent tumor-specific immunity. This vaccine represents an attractive therapeutic strategy for the induction of individualized antitumor immunity.


Figures

<b>Figure 1</b>
Figure 1
Construction and evaluation of the Ad-BD2-E1A. (a) Construction of bicistronic Ad-BD2-E1A and Ad-E1A. Schematic representation of pShuttle vectors is shown. (b) In vitro expression of BD2 (~4 kd). Western blot analysis of cell extracts from HEK-293 cells infected with Ad-BD2-E1A (lane 1) and Ad-E1A (lane 2). Western blots were performed with rabbit antihuman BD2 mAb as described in Materials and Methods. (c) Expression of BD2 in JC tumor cells. JC cells were transduced with Ad-BD2-E1A and Ad-E1A. After 48 hours, the cells were analyzed by intracellular hBD2 staining. (d) Secretion of human BD2 was assessed by ELISA in the supernatants of JC cells transduced with Ad-E1A or Ad-BD2-E1A. CMV, cytomegalovirus; ELISA, enzyme-linked immunosorbent assay; FITC, fluorescein isothiocyanate; hBD2, human β-defensin-2; IRES, internal ribosome entry site.
<b>Figure 2</b>
Figure 2
Chemotactic properties of BD2 on dendritic cells (DCs). (a) Chemotaxis of DCs was measured by migration through a polycarbonate filter with 5 µm pore size. Cos-1 cells were transfected with pShuttle-BD2-E1A (BD2-E1A), pShuttle-E1A (E1A), or pShuttle (mock) with Gene Porter. The cell supernatants collected 48 hours post-transfection were used as an assay media. Migrated cells were harvested and counted by automatic Z2 COULTER Cell Counter. Chemotaxis index is the fold-increase in the number of migrating cells in the presence of test factors over the spontaneous cell migration (mock-transfected cells). Each experiment was performed twice with triplicate wells. Top panel: plasmacytoid DCs; bottom panel: myeloid DCs. (b) In vitro migration of mouse plasmacytoid DCs to different concentrations of recombinant human BD2. Plasmacytoid DCs were labeled with Green-CMFDA cell tracker and added to the upper chamber. Fluorescence of cells migrated through the microporous membrane was measured in triplicates. Fluorescence intensity of spontaneously migrating cells into the media without BD2 was subtracted from each condition. (c) Plasmacytoid DCs were cultured overnight with 500 ng/ml of recombinant BD2, 5 µmol/l CpG ODN or left untreated (mock). The expression of CD40 and CD8a was evaluated by flow cytometry on CD11c+B220+ gated pDCs. (d) Tumor single-cell suspensions were stained with anti-mouse mAb CD11c, B220, CD8α. DCs were gated as large cell population (gate R1) and CD11c+ positive cells (gate R2). Dot plots shown are representative of results from three mice per group. Percentage of cells in each quadrant is shown. (e) Frequency of CD11c+B220+CD8+ plasmacytoid DCs in JC tumors assessed by flow cytometry in three mice per group. (f) Immunofluorescent staining of frozen sections of JC carcinoma tissue. Plasmacytoid DCs were identified in tumor sections from Ad-BD2-E1A, Ad-E1A, and PBS-injected mice by labeling with anti-mouse mAb to CD11c, B220 and CD40 (left panel). Superposition of CD11c, B220, and CD40 in Ad-BD2-E1A injected tumor (right panel). FSC, forward scatter; PBS, phosphate-buffered saline; SSC, side scatter.
<b>Figure 3</b>
Figure 3
Treatment with Ad-BD2-E1A inhibits the growth of established tumors and blocks the secondary tumors formation. (a) 5 × 10⁵ JC cells were injected s.c. into the right flank of Balb/c mice. Groups of mice (N = 6) were injected intratumorally with 1 × 10¹⁰ ifu of Ad-BD2-E1A, Ad-E1A, or PBS on 7, 8, and 14 days after JC cell inoculation. Tumors were resected when they reached about 10 mm in diameter in PBS group (day 15–16 after the first adenoviral treatment), *P < 0.05. (b) Resistance to rechallenged JC tumor after in situ Ad-BD2-E1A vaccination. After treatment and resection of JC tumors as described above, mice were rechallenged with 105 JC tumor cells in the opposite flank. Percentages of tumor-free mice are shown 3 weeks after rechallenge. (c) Ad-BD2-E1A treatment blocks metastasis of JC breast cancer cells to the lungs and livers. Mice were killed on day 22 after the first adenoviral injection. Organs from three mice of each group were collected and fixed in Bouin's solution. Hematoxylin–eosin staining was performed on formalin-fixed paraffin-embedded lung and liver tissues from mice bearing JC breast tumors. Representative pictures were from nine sections (three sections, 5 µm-thick from three different mice of each group) at ×20 magnification. (d) Mean number of pulmonary and liver surface tumor nodules counted under dissecting microscope. Representative gross image of fixed lungs with visible JC metastatic nodules is shown. Representative results from two experiments (N = 3). (e) JC cells were transfected with pcDNA 3.1 (Invitrogen) expressing human BD2 or pcDNA empty vector. After 4–6 weeks of Zeocin selection (500 µg/ml), the drug-resistant clones were inoculated into the right flanks of six mice. Tumor growth was measured twice a week and mice inoculated with JC (wild type) cells were killed when tumors were >15 mm in diameter, *P < 0.05. (f) Parental E.G7-OVA tumors were established s.c. into the right flank of C57BL/6 mice (N = 7). Graph shows tumor growth in mice intratumorally injected with Ad-BD2-E1A, Ad-E1A, and PBS as described above. (g) Mice (N = 7) were inoculated with E.G7-OVA tumor cells (distant tumors) s.c. into the left flank before first treatment with adenovirus. Graph depicts the growth of these distant tumors, which were not treated with the adenoviruses. Error bars represent standard error of the mean. OVA, ovalbumin; PBS, phosphate-buffered saline; s.c., subcutaneously; WT, wild type.
<b>Figure 4</b>
Figure 4
Enhanced E.G7-tumor-specific T-cell responses induced by intratumoral administration of Ad-BD2-E1A. (a) Peripheral blood was collected from the E.G7-bearing mice 10 days after the final adenoviral immunization. Left panel, CD8+ and SIINFEKL H2-Kb+ double positive cells were gated in a circular gate. Right panel, percentage of tetramer-positive CD8+ T cells in the peripheral blood of three mice in each group. *P < 0.05 between tetramer-positive CD8 T cells in the blood of Ad-BD2-E1A-treated group compared with Ad-E1A and PBS groups. (b) Splenocytes from E.G7-bearing mice treated with Ad-BD2-E1A, Ad-E1A, or PBS were analyzed in IFN-γ ELIspot assay with either 1 µg/ml of SIINFEKL peptide (OT-1), ISQAVHAAHAEINEAGR (OT-2), or TRP-2 (irrelevant H2-Kb-restricted) peptides. The number of IFN-γ-producing lymphocytes was evaluated in triplicate wells. Average ± SD for each mouse was calculated and the assays were repeated twice. (c) Splenocytes from E.G7-bearing mice were tested for cytolytic activity in a standard 6-hour 51Cr-release assay. Target cells labeled with 51Cr were placed in each well of 96-well plates, and 50 µl of effector T cells for each dilution was added. The supernatant from each well was harvested, and the amount of 51Cr radioactivity released was measured in a γ counter. (d) E.G7-specific CTL response in Ad-BD2-E1A treated mice. EL-4 cell line was used as irrelevant control. Two micrograms of monoclonal anti-mouse CD8 mAb was added for the blocking assay for splenocytes from Ad-BD2-E1A treated mice; E:T (effector:target) ratio is 50:1. Yac-1 cells were used for blocking the NK-activity at a Yac-1 to E.G7 cell ratio of 50:1. FITC, fluorescein isothiocyanate; IFN, interferon; NK, natural killer; PBS, phosphate-buffered saline.
<b>Figure 5</b>
Figure 5
Potent JC-specific CTL responses induced by Ad-BD2-E1A in situ vaccinations. (a) Splenocytes from JC-bearing mice treated with Ad-BD2-E1A, Ad-E1A or PBS were analyzed with IFN-γ ELIspot assay. DCs from naive mice pulsed with JC or CT26 (control) tumor lysates were used as antigen-presenting cells at 1:100 ratio. (b) CTL response was induced by Ad-BD2-E1A intratumoral vaccination. Splenocytes were tested for cytolytic activity with a standard 6-hour 51Cr-release assay. CTLs (1.5 × 10⁶ cells) were stimulated with JC tumor lysates at a T cell: JC tumor cell ratio of 2:1 for 5 days. Target cells labeled with 51Cr were placed in each well of 96-well plates, and 50 µl of effector T cells for each dilution was added. The supernatant from each well was harvested, and the amount of 51Cr radioactivity released was measured in a γ counter. (c) JC-specific CTL response in Ad-BD2-E1A treated mice. CT26 colon carcinoma used as irrelevant control. E:T (effector:target) ratio is 100:1. (d) 2 µg of monoclonal anti-mouse CD4 or CD8 Abs were added for blocking CTL activity of splenocytes from Ad-BD2-E1A treated mice; E:T ratio is 100:1. The assays were performed three times or more. Abs, antibodies; CTL, cytotoxic T lymphocytes; DCs, dendritic cells; IFN, interferon; PBS, phosphate-buffered saline.
<b>Figure 6</b>
Figure 6
DCs from Ad-BD2-E1A-treated mice stimulate antitumor T cell responses. (a) Splenic DCs from Ad-BD2-E1A immunized mice prime CTL response. Balb/c mice were inoculated with JC cells, and intratumorally injected with different adenoviral vector. Splenic DCs were isolated from Ad-BD2-E1A, Ad-E1A, or PBS-treated mice with anti-mouse CD11c microbeads. Naive splenocytes were cocultured with the DCs at the ratio 100:1 for 7 days as described in Materials and Methods. Splenocytes were tested for cytolytic activity against JC cells in a standard 6-hour 51Cr-release assay. CT26 colon carcinoma cells served as irrelevant control. The assay was repeated two times. (b) Tumoral DCs from Ad-BD2-E1A treated mice enhance CD8 T-cell responses. Tumors were established s.c. into both flanks of six mice of each treatment group. Forty-eight hours after the adenoviral injections, tumors were resected and tumoral DCs were purified as described in Materials and Methods. Graded numbers of CD11c+-enriched tumoral DCs cultured for 3 days in vitro were cocultured with 3 × 10⁵ purified naive CD8+ T cells in the presence of anti-CD3 for 3 days. In the last 16 hours, 3H-thymidine (1 µCi/well) was added into the cell culture to monitor the T-cell proliferation, (c) IFN-γ and (d) IL-2 secretion were measured 16 hours later. cpm, counts per minute; DCs, dendritic cells; E:T, effector-to-target ratio; IL, interleukin; IFN, interferon; PBS, phosphate-buffered saline; s.c., subcutaneously.
<b>Figure 7</b>
Figure 7
Ad-BD2-E1A-induced immune responses are abrogated in TLR4-deficient mice. JC tumor cells were subcutaneously inoculated into right flank of TLR4-deficient and wild type (WT) Balb/c mice (N = 6 in each group). Mice were intratumorally treated with 1010 ifu of Ad-BD2-E1A three times as described in Figure 3. (a) Tumor growth was monitored until tumors reached about 10 mm in diameter in TLR4-deficient group (15–16 days after first intratumoral injection). Error bars represent standard error of the mean. (b) IFN-γ ELIspot assay was used to determine the number of JC-specific T cells induced in TLR4-deficient and WT Balb/c mice by Ad-BD2-E1A vaccine. IFN, interferon; TLR, toll-like receptor.

Similar articles

Cited by

References

    1. Stoler DL, Chen N, Basik M, Kahlenberg MS, Rodriguez-Bigas MA, Petrelli NJ, et al. The onset and extent of genomic instability in sporadic colorectal tumor progression. Proc Natl Acad Sci USA. 1999;96:15121–15126. - PMC - PubMed
    1. Hanada K, Yewdell JW., and , Yang JC. Immune recognition of a human renal cancer antigen through post-translational protein splicing. Nature. 2004;427:252–256. - PubMed
    1. Vigneron N, Stroobant V, Chapiro J, Ooms A, Degiovanni G, Morel S, et al. An antigenic peptide produced by peptide splicing in the proteasome. Science. 2004;304:587–590. - PubMed
    1. Pardoll DM. Inducing autoimmune disease to treat cancer. Proc Natl Acad Sci USA. 1999;96:5340–5342. - PMC - PubMed
    1. Bowne WB, Srinivasan R, Wolchok JD, Hawkins WG, Blachere NE, Dyall R, et al. Coupling and uncoupling of tumor immunity and autoimmunity. J Exp Med. 1999;190:1717–1722. - PMC - PubMed

Publication types

MeSH terms