. 2009 Jul 7;9(13):1874-81.
doi: 10.1039/b823062e. Epub 2009 Mar 31.

Microfluidics for cryopreservation

Affiliations

Microfluidics for cryopreservation

Young S Song et al. Lab Chip. .

Abstract

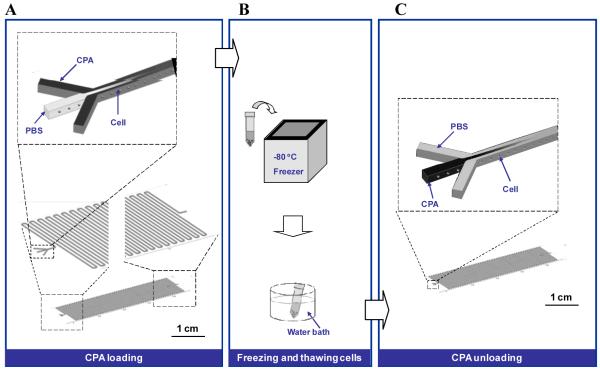
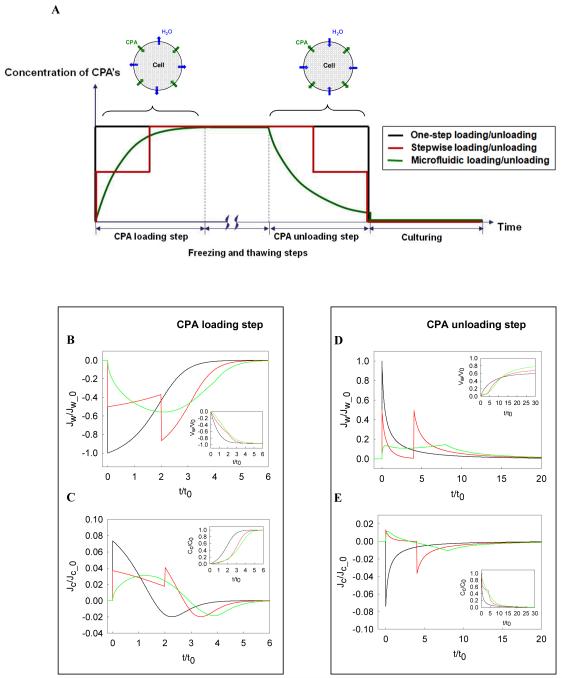
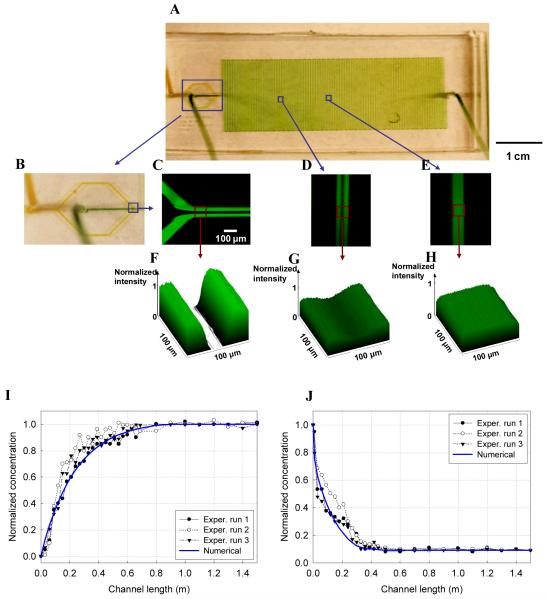
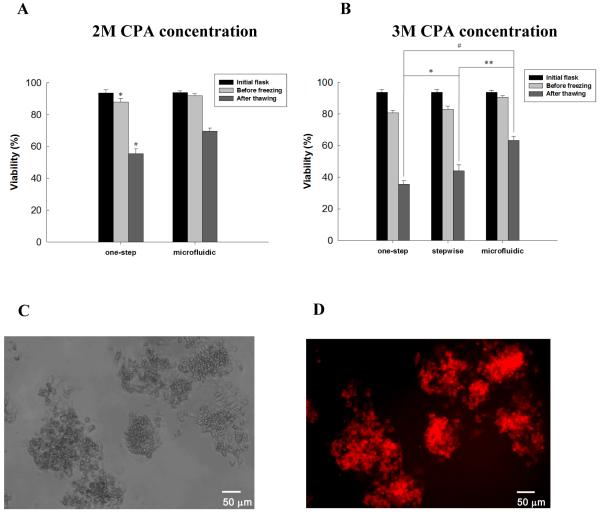
Minimizing cell damage throughout the cryopreservation process is critical to enhance the overall outcome. Osmotic shock sustained during the loading and unloading of cryoprotectants (CPAs) is a major source of cell damage during the cryopreservation process. We introduce a microfluidic approach to minimize osmotic shock to cells during cryopreservation. This approach allows us to control the loading and unloading of CPAs in microfluidic channels using diffusion and laminar flow. We provide a theoretical explanation of how the microfluidic approach minimizes osmotic shock in comparison to conventional cryopreservation protocols via cell membrane transport modeling. Finally, we show that biological experiments are consistent with the proposed mathematical model. The results indicate that our novel microfluidic-based approach improves post-thaw cell survivability by up to 25% on average over conventional cryopreservation protocols. The method developed in this study provides a platform to cryopreserve cells with higher viability, functionality, and minimal inter-technician variability. This method introduces microfluidic technologies to the field of biopreservation, opening the door to future advancements at the interface of these fields.


Figures

Figure 1
Figure 1
Schematic depiction of cell cryopreservation as introduced in this study. The microfluidic approach consists of three steps: (A) CPA loading; (B) freezing and thawing; and (C) CPA unloading. The microfluidic device was employed in an effort to progressively change the concentration of cyroprotectants prior to freezing and following thawing. In the CPA loading step (A), cells travel along the microfluidic channel, thereby experiencing a gradual change in CPA concentration. This can minimize osmotic shock to the cell. In the cell freezing and thawing steps (B), we followed a standard cryopreservation protocol. To unload the CPA from cells after thawing, they were infused into the microfluidic channel with a PBS buffer injecting through the two side channels at the same time (C).
Figure 2
Figure 2
Effect of different CPA loading/unloading profiles on mass transport across cell membranes. (A) Schematic diagram of three different profiles considered in this study: one-step, stepwise, and microfluidic CPA loading/unloading. These different CPA loading/unloading scenarios lead to distinct mass transport profiles across cell membranes ((B)-(E)), which consequently results in different cell viabilities during cryopreservation. To understand the mass transport more comprehensively, we defined characteristic parameters and then non-dimensionalized physical quantities obtained through numerical modeling: initial water volume in the cell, V0, final CPA concentration, C0, characteristic time, t0=V0A0RTC0Lp, and initial water flux, Jw_0=V0A0t0, and initial CPA flux, Jc_0=C0A0t0. (B) Dimensionless water fluxes across cell membrane during the CPA loading step. It was identified that the CPA loading/unloading profiles yield strikingly distinct water fluxes. The volume change of water drawn out of the cell is presented in the smaller diagram. (C) Dimensionless CPA fluxes through cell membrane are presented. Similarly to the water flux (B), the one-step loading was found to have the largest flux. In the smaller diagram, the change in CPA concentration was elucidated with respect to dimensionless time. (D) Dimensionless water fluxes across cell membrane during CPA unloading step is shown. The mass transport during the CPA unloading step is different from that in the CPA loading step. The volume change of water penetrating into a cell was demonstrated in the smaller figure. (E) Dimensionless CPA fluxes across cell membrane during the CPA unloading step. The smaller figure presents the change in the CPA concentration in a cell over time. Overall, these changes in water and CPA fluxes across cell membrane (B)-(D) demonstrate how the microfluidic CPA loading/unloading approach can minimize the osmotic shock compared to the standard cryopreservation methods, one-step and stepwise loading/unloading cases.
Figure 3
Figure 3
(A) Photograph of the microfluidic device created in this study. The device possesses a long microfluidic channel with three inputs and one outlet, which offers long distance to develop a complete diffusion along the channel. The yellow and green colored fluids were infused into the microfluidic channel to show the inlet. (B) Magnified image around the outlet of the channel is shown. To observe the CPA diffusion behavior experimentally, a fluorescent stain (FITC) was injected along with CPAs ((C)-(E)). Using the fluorescent intensity, the normalized 3D intensity images were prepared ((F)-(H)). As the CPAs flow along the channel, it was identified that the CPAs diffuse into the center of the channel until concentration equilibrium((F)-(H)). The intensity was measured on area of 100 μm×100 μm and the intensity was normalized by using the maximum intensity. (I) Normalized CPA concentration variation along the microfluidic channel in the CPA loading step is shown. The flow rates of the CPA and cell suspension were kept at 20 μl/min each. Three independent experiments were conducted. The experimental and numerical results were in agreement. The concentration increased progressively through diffusion as we expected. (J) Normalized CPA concentration during unloading step is shown. The applied flow rates for the PBS and cell suspension were 20 μl/min and 2 μl/min, respectively. The concentration obtained experimentally as well as numerically decreased gradually.
Figure 4
Figure 4
(A) Viabilities measured through conventional one-step and microfluidic approaches in the case of 2M CPA concentration. In each sample, three different viabilities were measured: initial state, before freezing and after thawing. Data are mean±SD (n=3) obtained from three independent experiments. Statistical difference (P<0.05) between the viabilities before freezing are denoted with an asterisk(*). # represents a statistical difference (P<0.01) between the viabilities after thawing. (B) Viabilities obtained in the case of 3M CPA concentration are shown. An experiment to change the CPA concentration stepwise (1.5 M through 3 M) was added. Here, *, P<0.05; **, P<0.01; #, P<0.01. (C) Bright field image taken after long-term culture (day 7). (D) Resorufin fluorescent image indicates the functionality of the thawed cells. Resazurin, a non-toxic and stable reagent that allows long-term monitoring of proliferating cells, for which it is reduced to resorufin.

References

    1. Burns MA, Johnson BN, Brahmasandra SN, Handique K, Webster JR, Krishnan M, Sammarco TS, Man PM, Jones D, Heldsinger D, Mastrangelo CH, Burke DT. Science. 1998;282:484–487. - PubMed
    1. Hong JW, Quake SR. Nat Biotechnol. 2003;21:1179–1183. - PubMed
    1. Okamoto T, Suzuki T, Yamamoto N. Nat Biotechnol. 2000;18:438–441. - PubMed
    1. Khademhosseini A, Yeh J, Eng G, Karp J, Kaji H, Borenstein J, Farokhzad OC, Langer R. Lab Chip. 2005;5:1380–1386. - PubMed
    1. Demirci U. Journal Of Microelectromechanical Systems. 2006;15:957–966.

Publication types

Substances