. 2009 Jun 17:10:270.
doi: 10.1186/1471-2164-10-270.

Host cell transcriptional profiling during malaria liver stage infection reveals a coordinated and sequential set of biological events

Affiliations

Host cell transcriptional profiling during malaria liver stage infection reveals a coordinated and sequential set of biological events

Sónia S Albuquerque et al. BMC Genomics. .

Abstract

Background: Plasmodium sporozoites migrate to the liver where they traverse several hepatocytes before invading the one inside which they will develop and multiply into thousands of merozoites. Although this constitutes an essential step of malaria infection, the requirements of Plasmodium parasites in liver cells and how they use the host cell for their own survival and development are poorly understood.

Results: To gain new insights into the molecular host-parasite interactions that take place during malaria liver infection, we have used high-throughput microarray technology to determine the transcriptional profile of P. berghei-infected hepatoma cells. The data analysis shows differential expression patterns for 1064 host genes starting at 6 h and up to 24 h post infection, with the largest proportion correlating specifically with the early stages of the infection process. A considerable proportion of those genes were also found to be modulated in liver cells collected from P. yoelii-infected mice 24 and 40 h after infection, strengthening the data obtained with the in vitro model and highlighting genes and pathways involved in the host response to rodent Plasmodium parasites.

Conclusion: Our data reveal that host cell infection by Plasmodium sporozoites leads to a coordinated and sequential set of biological events, ranging from the initial stage of stress response up to the engagement of host metabolic processes and the maintenance of cell viability throughout infection.


Figures
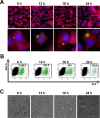
Figure 1
Figure 1
Isolation of GFP-expressing P. berghei ANKA sporozoites using FACS at 6, 12, 18 and 24 h p.i. (A) Pre-sorting images of infected cell populations (top panel, bar = 60 μm) or isolated cells (bottom panel, bar = 10 μm) at the respective time points p.i. (B) FACS plot of sorting experiments at the respective time points post-infection with the average reading obtained from 3 or more independent samples with results expressed as mean ± SD of green fluorescence. (C) Post-sorting images of infected cells.
Figure 2
Figure 2
Transcription profile analysis of the significant differentially expressed genes in P. berghei infected vs. non infected hepatoma cells. (A) Hierarchical clustering using Euclidean distances for both samples (column, expressed as mean of replicates) and genes (probesets) showing differential expression (B stat > 0, FC >1.5×). (B) Principal component analysis (PCA) of transcript profiles from infected and non-infected Hepa1-6 cells. The plot shows simplified dataset structure of the significant differentially expressed probesets and clearly groups the samples in a 3-dimensional space between infected and non-infected cells but also along Plasmodium developmental time. Black, red, green and blue dots represent infected cells at 6, 12, 18 and 24 h p.i. respectively, while turquoise, pink, yellow and grey dots represent non-infected cells at 6, 12, 18 and 24 h p.i.
Figure 3
Figure 3
Quantification of gene expression of P. berghei infected hepatocytes. Relation between Microarray and qRT-PCR Fold change values for 6 genes. The qRT-PCR fold-changes were normalised using the expression of a housekeeping gene (hprt1) and compared with those obtained from non-infected cells.
Figure 4
Figure 4
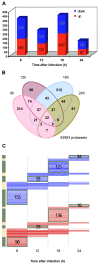
Over- and under-expressed host genes across time in infected cells compared to non-infected ones. (A) Venn diagram showing the repartition of the differentially expressed host transcripts at the 4 time points in malaria infected vs. non infected cells. The intersections show the number of probesets present in more than 1 time point. The numbers within separated ellipses correspond to differentially expressed genes that are unique to each time point. (B) Number of genes DE for each time point after normalisation and linear model fitting. Genes with more than one DE probeset presenting a consistent fold change were counted. Up- and down-regulated genes are shown in red and blue, respectively. The y-axis represents the number of differentially expressed genes (DEG). (C) Heatmap comparing the genes significantly altered between P. berghei infected cells vs. non infected ones. Each row of the plot is a gene and was coloured according to the log2 ratio of expression, with red meaning up-regulation in infected cells relative to the non-infected ones and blue meaning down-regulation. The heatmaps were generated using the heatmap.2 function of the "gplots" package in R. The dendrograms were generated using Euclidean distance and "complete" agglomeration method. The 3D PCA was generated using "scatterplot3d" package in R.
Figure 5
Figure 5
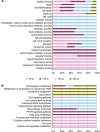
Gene set enrichment analysis. (A) Gene Ontology enrichment analysis (p < 0.01) based on GOslim. Genes found significant in the analysis were grouped by function following GO annotation. The stacked bars show the contribution of each time point across categories. Time points are colored as indicated on the graph. (B) KEGG metabolic pathway enrichment analysis calculated using the DEG having a KEGG annotation. Significantly enriched pathways are marked with a * (for p < 0.01).
Figure 6
Figure 6
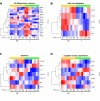
Heatmaps of DE genes in P. berghei infected vs. non-infected cells. for (A) Inflammatory response (GO:0006954), (B) Fatty acid metabolism (KEGG metabolic pathway mmu00071), (C) Apoptosis (KEGG metabolic pathway mmu04210), (D) Regulation of actin cytoskeleton (KEGG metabolic pathway mmu04810).

References

    1. Guerra CA, Gikandi PW, Tatem AJ, Noor AM, Smith DL, Hay SI, Snow RW. The limits and intensity of Plasmodium falciparum transmission: implications for malaria control and elimination worldwide. PLoS Med. 2008;5:e38. doi: 10.1371/journal.pmed.0050038. - DOI - PMC - PubMed
    1. Sinnis P, Zavala F. The skin stage of malaria infection: biology and relevance to the malaria vaccine effort. Future Microbiol. 2008;3:275–278. doi: 10.2217/17460913.3.3.275. - DOI - PubMed
    1. Frevert U, Engelmann S, Zougbede S, Stange J, Ng B, Matuschewski K, Liebes L, Yee H. Intravital observation of Plasmodium berghei sporozoite infection of the liver. PLoS Biol. 2005;3:e192. doi: 10.1371/journal.pbio.0030192. - DOI - PMC - PubMed
    1. Mota MM, Pradel G, Vanderberg JP, Hafalla JC, Frevert U, Nussenzweig RS, Nussenzweig V, Rodriguez A. Migration of Plasmodium sporozoites through cells before infection. Science. 2001;291:141–144. doi: 10.1126/science.291.5501.141. - DOI - PubMed
    1. Prudencio M, Rodriguez A, Mota MM. The silent path to thousands of merozoites: the Plasmodium liver stage. Nat Rev Microbiol. 2006;4:849–856. doi: 10.1038/nrmicro1529. - DOI - PubMed

Publication types