. 2009 Aug 14;284(33):22222-22237.
doi: 10.1074/jbc.M109.029850. Epub 2009 Jun 17.

Structure, function, and targets of the transcriptional regulator SvtR from the hyperthermophilic archaeal virus SIRV1

Affiliations

Structure, function, and targets of the transcriptional regulator SvtR from the hyperthermophilic archaeal virus SIRV1

Florence Guillière et al. J Biol Chem. .

Abstract

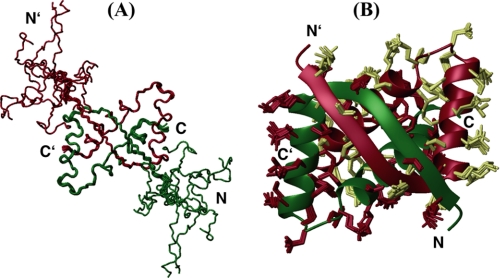
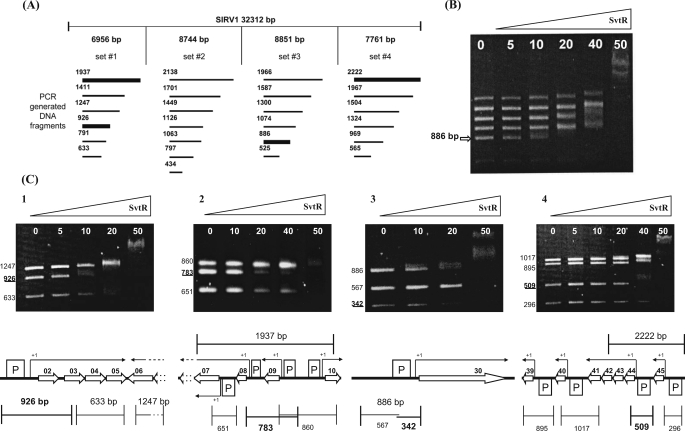
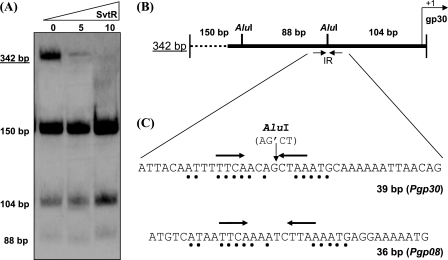
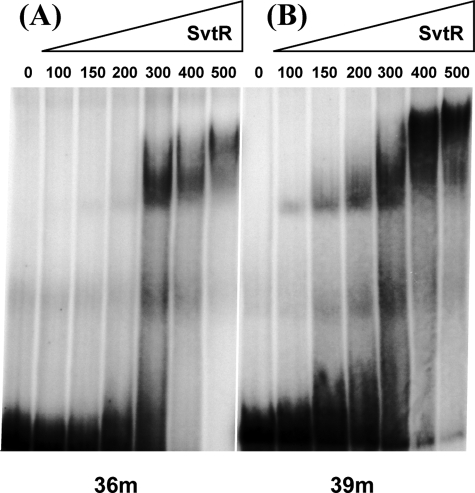
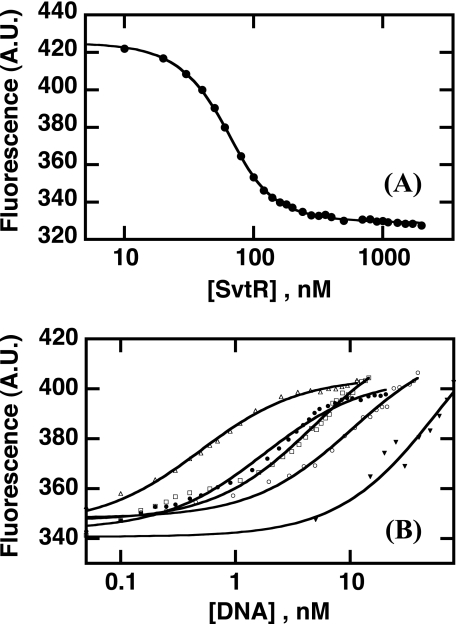
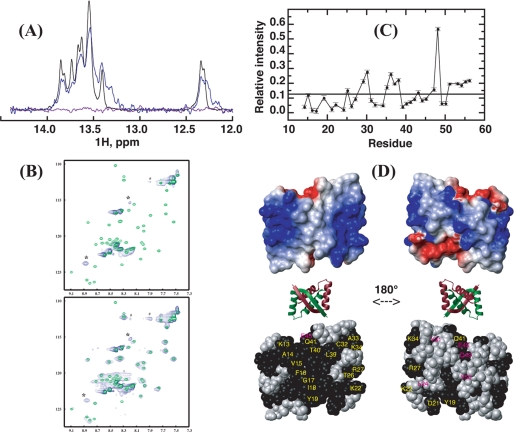
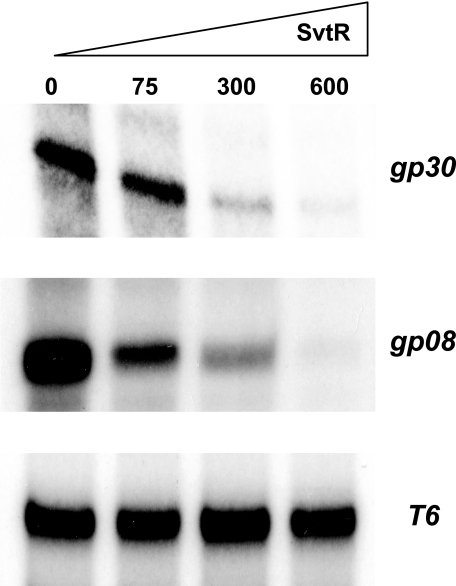
We have characterized the structure and the function of the 6.6-kDa protein SvtR (formerly called gp08) from the rod-shaped virus SIRV1, which infects the hyperthermophilic archaeon Sulfolobus islandicus that thrives at 85 degrees C in hot acidic springs. The protein forms a dimer in solution. The NMR solution structure of the protein consists of a ribbon-helix-helix (RHH) fold between residues 13 and 56 and a disordered N-terminal region (residues 1-12). The structure is very similar to that of bacterial RHH proteins despite the low sequence similarity. We demonstrated that the protein binds DNA and uses its beta-sheet face for the interaction like bacterial RHH proteins. To detect all the binding sites on the 32.3-kb SIRV1 linear genome, we designed and performed a global genome-wide search of targets based on a simplified electrophoretic mobility shift assay. Four targets were recognized by the protein. The strongest binding was observed with the promoter of the gene coding for a virion structural protein. When assayed in a host reconstituted in vitro transcription system, the protein SvtR (Sulfolobus virus transcription regulator) repressed transcription from the latter promoter, as well as from the promoter of its own gene.


Figures

FIGURE 1.
FIGURE 1.
Structure of SvtR. Main-chain trace representation of the structural ensemble of 10 conformers of the full-length protein (residues 1–56) (A) and ribbon representation of residues 11–56 (B). In B, the heavy side chains of the 10 conformers are shown on the ribbon diagram of the lowest energy structure. Monomers are shown in different colors.
FIGURE 2.
FIGURE 2.
15N relaxation rates (R2, R1 and R2/R1), heteronuclear 15N-1H NOE, and order (S2) and conformational exchange (Rex) Lipari-Szabo parameters of SvtR plotted as a function of residue number. Experiments were performed at 25 °C and a proton frequency of 499.8 MHz as described under “Experimental Procedures.” The secondary structure of SvtR is indicated on the top with black boxes (S = strand, H = helix). Relaxation data for residues 12, 33, 37, and 51 are not shown because of partial overlap of their corresponding signals. Data for residues 9 (overlap with 12) and 10 (overlap with 33) are included, however, because the amide group of these residues, which are located in the unfolded N-terminal region, gave strong signals that were less influenced by the overlapping signals. Order parameters are shown only for residues that were fit at a confidence level ≥ 0.9.
FIGURE 3.
FIGURE 3.
Identification of the SvtR binding sites by the AG-EMSA approach. A, AG-EMSA strategy of the global protein-DNA interaction study for SIRV1. The SIRV1 genome was divided into four sets incubated separately with the SvtR protein in varying amounts (indicated in B and C in nanograms) and migrated on 1.2% agarose gels. The bold lines represent DNA fragments whose mobility changed specifically, i.e. at low concentrations of SvtR. B, typical results obtained with initial sets of DNA fragments (illustrated with set 3). The arrow indicates the position of the specifically responding fragment of 886 bp. C, AG-EMSA results that led to the identification of the SvtR targets and their positions on the genetic map of SIRV1. The strongest binding was observed in C3 with the gp30 promoter region. C1, a fragment of 926 bp was identified as specifically responding to SvtR in the first round of analysis. The scheme indicates this fragment's position that covered the promoter region for the operon gp02/03/04/05. C2, a 1937-bp fragment initially identified was divided into three subfragments. The 783-bp subfragment showed the strongest response to SvtR. This fragment covers the gp08 and gp09 promoters. because the gp09 promoter region was also included in a 860-bp fragment that did not specifically respond in the assay, it was concluded that the gp08 promoter region was involved in the specific binding of SvtR. C3, the initially identified 886-bp fragment was divided into two subfragments. In this analysis, the 342-bp fragment responded specifically. As indicated in the scheme, this fragment covers the gp30 promoter region. C4, a 2222-bp fragment covering two promoter regions was identified in the initial round of AG-EMSA. A 509-bp fragment was identified when subfragments were analyzed; its position covering the promoter region for the operon gp44-43-42-41 is indicated in the corresponding scheme.
FIGURE 4.
FIGURE 4.
Target identification within the promoter of gp30. A, PAGE-EMSA analysis of the radioactively labeled 342-bp DNA fragment and of its derivatives obtained by digestion with the AluI restriction enzyme. Protein amounts are shown in nanograms. B, scheme presenting a physical map of the 342-bp fragment. The positions of the AluI restriction sites are indicated. The black arrows show the position of the inverted repeat (IR) upstream of the gp30 gene transcription start site. C, sequence comparison of two identified SvtR short targets, 36m (Pgp08) and 39m (Pgp30). Black dots indicate the identical parts present in the inverted repeat region of both sequences. Black arrows show the position of the inverted repeats identified in both promoter regions.
FIGURE 5.
FIGURE 5.
The binding of SvtR to the 36m (A) and 39m (B) oligonucleotides is specific. The PAGE-EMSA were performed in the presence of a strong excess (13-fold) of competitor nonspecific DNA, poly[dI,dC]. The amounts of SvtR used are indicated in nanograms. Binding is observed from 300 ng of SvtR for the 36m and from 100 ng for the 39m.
FIGURE 6.
FIGURE 6.
Interaction of SvtR with oligonucleotides 36m, 39m, 70m, 120m, and nonspecific DNA (poly[dIG,dC]) followed by fluorescence. A, binding of SvtR to fluorescein-labeled 36m oligonucleotide (flDNA). Fluorescence intensity (arbitrary units) as a function of total protein concentration. The solid line corresponds to the fit of the data (Equation 1 in the supplemental material) The dissociation constant (KD,fl) of the SvtR pair of dimers-flDNA complex obtained by non-linear least squares fitting was 1.6 ± 0.2 nm. B, competition of unlabeled DNA with fluorescein-labeled flDNA. Unlabeled oligonucleotides were added to 5 nm flDNA-100 nm protein samples. Poly[dIG,dC] was used as a nonspecific competitor in an independent assay. Solid lines correspond to fits of the data to Equation 5 in the supplemental material. The IC50,u values in nm units were, in decreasing affinity order 0.3 ± 0.2 (120m, ▵), 0.7 ± 0.2 (70m, ●), 1.3 ± 0.1 (39m, □), 1.6 ± 0.3 (36m, ○), and 15.2 ± 1.7 (poly[dIG,dC], ▾).
FIGURE 7.
FIGURE 7.
Interaction of SvtR and a 17-bp oligomer (17m) derived from the promoter region of the gp08 gene followed by NMR. Spectra were recorded at 25 °C with buffer D. A, imino region of the one-dimensional 1H spectrum of 17m DNA alone (black), and in the presence of SvtR dimer at a molar ratio of 1:1 (blue) or 1:2 (violet). B, superpositions of the 1H-15N HSQC spectra of SvtR dimer alone (green) and in the presence of the 17m DNA (blue). The molar ratio of protein dimer:DNA was 1:1 (top spectrum) or 6:1 (bottom). *, resonances that do not match the frequencies of isolated SvtR are indicated; #, noise ridge spurious signal; +, folded arginine side-chain signal, their 15N positions in the spectra are different because isolated protein and SvtR:17m spectra were acquired with different spectral widths; C, relative intensity (RI) of the 1H-15N HSQC signals of free SvtR signals in the presence of 17m (3 dimers per DNA molar ratio) and of isolated SvtR as a function of residue number. A threshold value was arbitrarily drawn at 0.12 RI. RI values are given in arbitrary units. Signals of residues 3–12, which showed high apparent RI values (1.7–7.2) are not displayed, because their intensities in the protein-DNA mixture were due to both free and bound protein. In D: top, surface electrostatic potential of SvtR best structure (blue = positive charge, red = negative charge); middle, ribbon diagram of the structure of SvtR to show the orientation of the surface representations; bottom, CPK representation of SvtR best structure. All the atoms of the residues with amide relative intensities lower than 0.12 are shown in black. Labels are shown only for one monomer in yellow for residues on the β-sheet face or in magenta for residues that are not exposed on the β-sheet face.
FIGURE 8.
FIGURE 8.
SvtR represses transcription from two SIRV1 promoters. The transcription regulator activity of SvtR was tested using an IVT. All reactions were performed in the presence of limiting amounts of transcription factors TBP and TFB. The added amounts of SvtR are shown in nanograms. Transcription assays from: gp30 promoter (top panel), gp08 promoter (middle panel), and T6 SSV1 promoter (bottom panel). Strong transcription repression was observed for the Pgp30, a weaker repression for the Pgp08, and no effect was seen with the control T6 promoter from an unrelated virus.

Similar articles

Cited by

References

    1. Torsvik T., Dundas I. D. (1974) Nature 248, 680–681 - PubMed
    1. Prangishvili D., Stedman K., Zillig W. (2001) Trends Microbiol. 9, 39–43 - PubMed
    1. Prangishvili D., Garrett R. A. (2004) Biochem. Soc. Trans. 32, 204–208 - PubMed
    1. Prangishvili D., Forterre P., Garrett R. A. (2006) Nat. Rev. Microbiol. 4, 837–848 - PubMed
    1. Prangishvili D., Garrett R. A., Koonin E. V. (2006) Virus Res. 117, 52–67 - PubMed

Publication types

Associated data

LinkOut - more resources