. 2009 Aug 7;284(32):21765-75.
doi: 10.1074/jbc.M109.004838. Epub 2009 Jun 17.

Printor, a novel torsinA-interacting protein implicated in dystonia pathogenesis

Affiliations

Printor, a novel torsinA-interacting protein implicated in dystonia pathogenesis

Lisa M Giles et al. J Biol Chem. .

Abstract

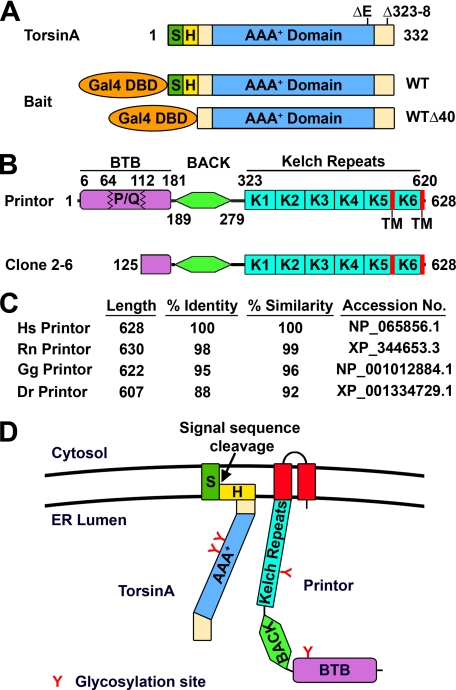
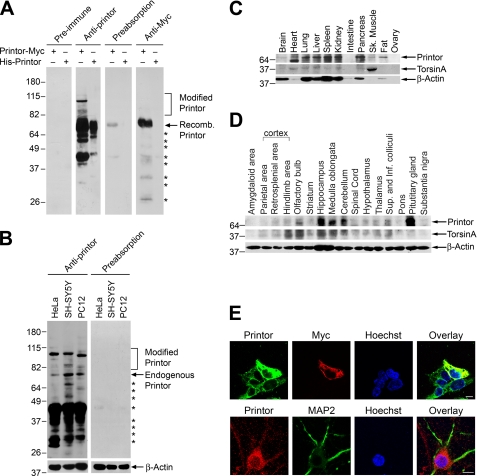
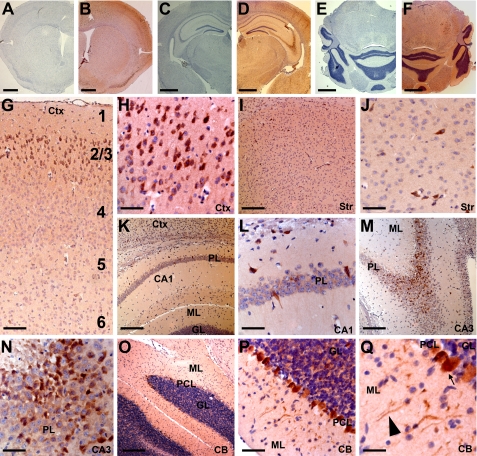
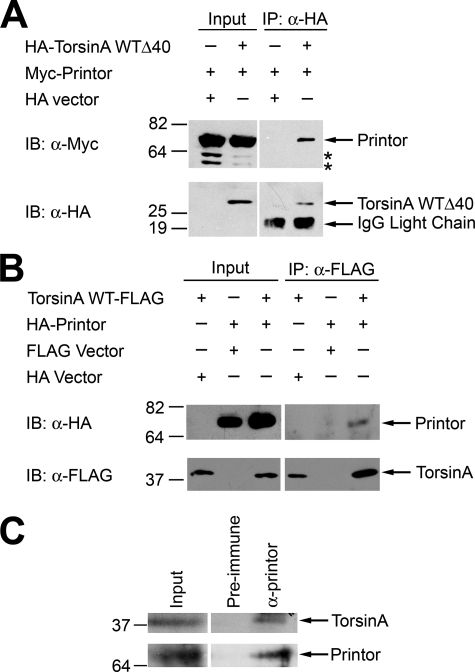
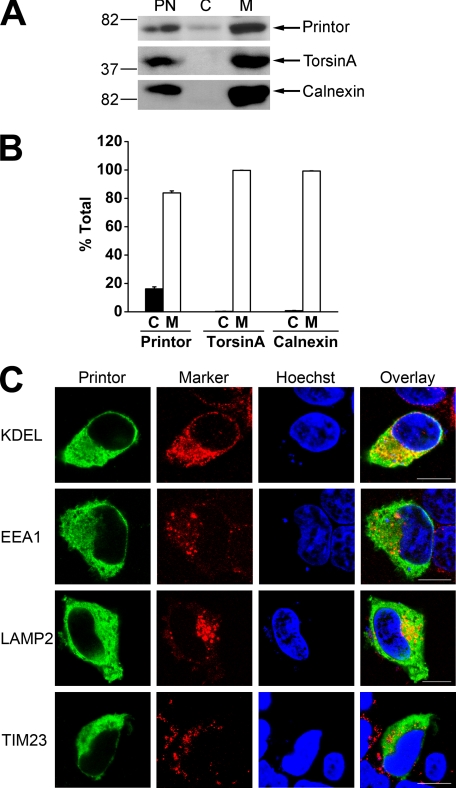
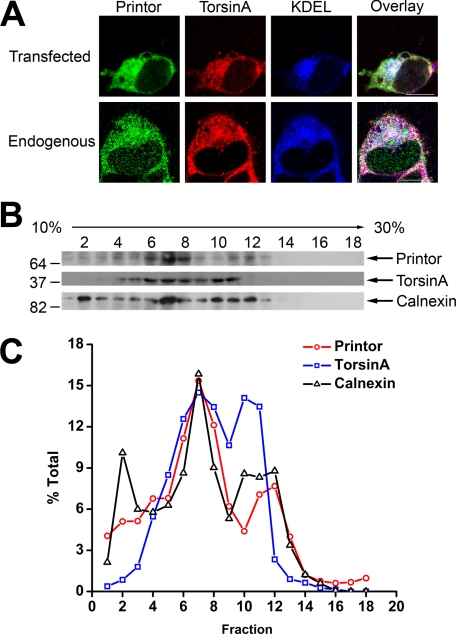
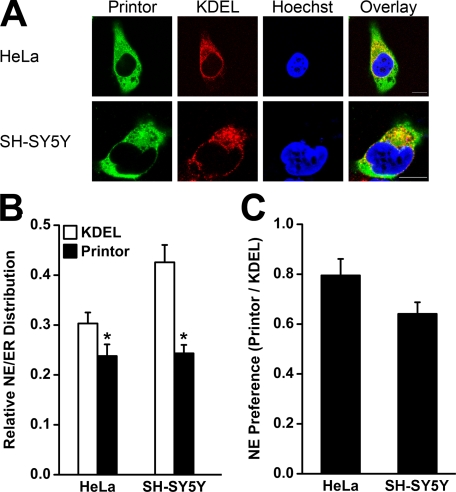
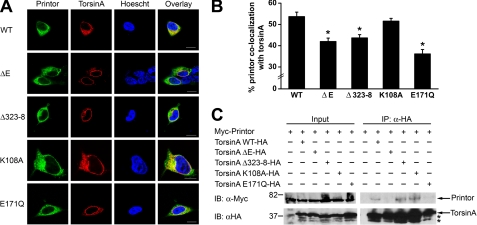
Early onset generalized dystonia (DYT1) is an autosomal dominant neurological disorder caused by deletion of a single glutamate residue (torsinA DeltaE) in the C-terminal region of the AAA(+) (ATPases associated with a variety of cellular activities) protein torsinA. The pathogenic mechanism by which torsinA DeltaE mutation leads to dystonia remains unknown. Here we report the identification and characterization of a 628-amino acid novel protein, printor, that interacts with torsinA. Printor co-distributes with torsinA in multiple brain regions and co-localizes with torsinA in the endoplasmic reticulum. Interestingly, printor selectively binds to the ATP-free form but not to the ATP-bound form of torsinA, supporting a role for printor as a cofactor rather than a substrate of torsinA. The interaction of printor with torsinA is completely abolished by the dystonia-associated torsinA DeltaE mutation. Our findings suggest that printor is a new component of the DYT1 pathogenic pathway and provide a potential molecular target for therapeutic intervention in dystonia.


Figures

FIGURE 1.
FIGURE 1.
Isolation of printor as a torsinA-interacting protein from a yeast two-hybrid screen. A, domain structure of torsinA. S, ER signal sequence; H, hydrophobic region. The locations of dystonia-associated torsinA mutations are indicated on the domain structure. Baits used for the yeast two-hybrid screens are indicated below the domain structure. Gal4 DBD, Gal4 DNA-binding domain. B, domain structure of printor (top) and the torsinA-interacting clone isolated from the yeast two-hybrid screen (bottom). BTB, broad complex, tramtrack, and bric-a-brac domain; P/Q, proline/glutamine-rich region; BACK, BTB and C-terminal Kelch domain; K, kelch repeat; TM, transmembrane domain. C, the amino acid sequence homology between human printor and its orthologues. Hs, Homo sapiens; Rn, Rattus norvegicus; Gg, Gallus gallus; Dr, Danio rerio. D, model of membrane topology of torsinA and printor at the ER. Potential glycosylation sites for both torsinA (Asn143 and Asn158) and printor (Asn146 and Asn433) are indicated.
FIGURE 2.
FIGURE 2.
Printor co-distributes with torsinA in multiple tissues and brain regions. A, lysates from transfected SH-SY5Y cells expressing Myc-tagged printor or purified His-tagged printor protein were analyzed by immunoblotting with preimmune serum, anti-printor antibody, anti-printor antibody preabsorbed with recombinant printor protein, or anti-Myc antibody. Recomb., recombinant. B, equal amounts of lysates (50 μg) from the indicated cells were analyzed by immunoblotting using anti-printor, preabsorbed anti-printor, and anti-β-actin antibodies. The asterisks indicate bands that probably represent printor degradation products. C, equal amounts of homogenates (100 μg) from the indicated rat tissues were analyzed by immunoblotting using anti-printor, anti-torsinA, and anti-β-actin antibodies. Sk., skeletal. D, equal amounts of homogenates (100 μg) from the indicated rat brain regions were analyzed by immunoblotting using anti-printor, anti-torsinA, and anti-β-actin antibodies. Sup., superior; Inf., inferior. E, SH-SY5Y cells overexpressing Myc-tagged printor (top) were immunostained with primary antibodies against printor and the Myc tag, followed by detection with secondary antibodies conjugated to Texas Red (Myc, red) or FITC (printor, green). Primary cortical neurons (bottom) were immunostained with primary antibodies against printor and MAP2, followed by detection with secondary antibodies conjugated to Texas Red (printor, red) or FITC (MAP2, green). Hoechst stain was used to visualize the nucleus. Scale bar, 10 μm. All data are representative of at least three independent experiments.
FIGURE 3.
FIGURE 3.
Immunohistochemical analysis of printor protein distribution in mouse brain. Coronal sections through striatum (A and B), hippocampus (C and D), and cerebellum (E and F) were immunostained with either anti-printor antibody (B, D, and F) or no primary antibody (A, C, and E) and counterstained with hematoxylin. G and H, printor immunostaining in the cortex (Ctx). Numbers indicate cortical layers. Neurons in the layers 2–3 were strongly stained. I and J, printor immunostaining in the striatum (Str). K and L, printor immunostaining in the hippocampal CA1 region. Printor immunoreactivity was seen in the pyramidal layer (PL) but not in the molecular (ML) or granular (GL) layers. M and N, printor immunostaining in the hippocampal CA3 region. Printor immunoreactivity was found in the PL but not in the ML. O–Q, printor immunostaining in the cerebellum (CB). Purkinje cell layer (PCL) neurons display intense immunostaining compared with the granular layer (GL). Purkinje cell projections in the molecular layer were also labeled. Arrow indicates cell body and the arrowhead indicates neuronal projection. Scale bar is 1.25 mm in A-F; 125 μm in G; 250 μm in I, K, M, and O; 60 μm in H, J, L, N, and P; 30 μm in Q.
FIGURE 4.
FIGURE 4.
Printor and torsinA interact in vivo. A, co-immunoprecipitation of printor with torsinA WTΔ40. Lysates from HeLa cells expressing either HA-tagged torsinA WTΔ40 or HA vector and Myc-tagged printor were subjected to immunoprecipitation with anti-HA antibody (12CA5). Immunoprecipitates were analyzed by immunoblotting (IB) with anti-HA and anti-Myc antibodies. The asterisks indicate potential degradation products of printor. B, co-immunoprecipitation of printor with full-length torsinA. Lysates from HeLa cells expressing HA-tagged printor or HA vector and C-terminal FLAG-tagged torsinA or FLAG vector were subjected to immunoprecipitation (IP) with anti-FLAG antibody. The immunoprecipitates were analyzed by immunoblotting with anti-FLAG and anti-HA antibodies. C, association of endogenous torsinA and printor in the mouse brain. Homogenates from mouse cerebellum were subjected to immunoprecipitation using anti-printor antibody or the preimmune serum, followed by immunoblot analysis with anti-printor and anti-torsinA antibodies.
FIGURE 5.
FIGURE 5.
Printor is found in both cytosolic and membrane-associated fractions. A, post-nuclear supernatant (PN) from SH-SY5Y cells was separated into cytosol (C) and membrane (M) fractions. Aliquots representing an equal percentage of each fraction were analyzed by immunoblotting with anti-printor, anti-torsinA, and anti-calnexin antibodies. B, the level of the indicated proteins in each fraction was quantified using NIH Scion Image and shown as a percentage of the total level of the indicated protein. Data represent mean ± S.E. from at least three independent experiments. C, SH-SY5Y cells expressing Myc-tagged printor were immunostained with anti-Myc and anti-KDEL, anti-EEA1, anti-LAMP2, or anti-TIM23 primary antibodies followed by detection with secondary antibodies conjugated to Texas Red (marker proteins, red) or FITC (printor, green). Hoechst stain was used to visualize the nucleus. Scale bars, 10 μm.
FIGURE 6.
FIGURE 6.
Co-localization of printor and torsinA in the ER. A, SH-SY5Y cells expressing Myc-tagged printor and C-terminal HA-tagged torsinA (top) were immunostained with primary antibodies against Myc, HA, and KDEL, followed by detection with secondary antibodies conjugated to Texas Red (torsinA, red), FITC (printor, green), or Cy5 (KDEL, blue). Untransfected SH-SY5Y cells (bottom) were immunostained with primary antibodies against printor, torsinA, and KDEL, followed by detection with secondary antibodies conjugated to Texas Red (torsinA, red), FITC (printor, green), or Cy5 (KDEL, blue). Scale bars, 10 μm. B, post-nuclear supernatant from SH-SY5Y cells was fractionated on a 10–30% Opti-Prep gradient into 18 fractions, with fraction 1 corresponding to the top of the gradient. Equal volumes of each fraction were analyzed by SDS-PAGE followed by immunoblotting using anti-printor, anti-torsinA, and anti-calnexin antibodies. C, the level of the indicated protein in each fraction was quantified using NIH Scion Image and shown as a percentage of the total level of the indicated protein. Data are representative of at least three independent experiments.
FIGURE 7.
FIGURE 7.
Printor displays ER preference in both HeLa and SH-SY5Y cells. A, HeLa (top) or SH-SY5Y (bottom) cells expressing Myc-tagged printor were stained with primary antibodies against Myc and ER marker KDEL, followed by detection with secondary antibodies conjugated to Texas Red (KDEL, red) or FITC (printor, green). Hoechst stain was used to visualize the nucleus. Scale bars, 10 μm. B, quantification shows the relative distribution of printor and KDEL in the NE versus the ER. Data represent mean ± S.E. (error bars) from at least three independent experiments. *, significantly different from the NE/ER ratio of KDEL (p < 0.05). C, NE preference of printor was determined by normalizing the NE/ER ratio of printor in HeLa or SH-SY5Y cells to the corresponding NE/ER ratio of KDEL in the same cells. Data represent mean ± S.E. from at least three independent experiments.
FIGURE 8.
FIGURE 8.
Printor interaction and co-localization with torsinA is disrupted by torsinA ΔE and E171Q mutations. A, co-localization between printor and WT or mutant torsinA. SH-SY5Y cells co-expressing Myc-tagged printor and C-terminal HA-tagged torsinA WT, torsinA ΔE, torsinA Δ323–328, torsinA K108A, or torsinA E171Q were stained with primary antibodies against HA and Myc, followed by detection with secondary antibodies conjugated to Texas Red (torsinA, red) or FITC (printor, green). Hoechst stain was used to visualize the nucleus. Scale bars, 10 μm. B, quantification shows the percentage of printor protein that co-localizes with WT or mutant torsinA. Data represent mean ± S.E. (error bars) from at least three independent experiments. *, significantly different from the percentage of printor co-localization with torsinA WT (p < 0.005). C, extracts from SH-SY5Y cells expressing Myc-tagged printor and C-terminal HA-tagged torsinA WT, torsinA ΔE, torsinA Δ323–328, torsinA K108A, or torsinA E171Q were subjected to immunoprecipitation (IP) with anti-HA antibody followed by immunoblotting (IB) with anti-HA and anti-Myc antibodies.
FIGURE 9.
FIGURE 9.
TorsinA E171Q mutation and dystonia-associated mutations promote translocation of torsinA from the ER to NE. A, SH-SY5Y cells expressing C-terminal HA-tagged torsinA WT, torsinA ΔE, torsinA Δ323–328, torsinA K108A, or torsinA E171Q were stained with primary antibodies against HA and ER marker KDEL, followed by detection with secondary antibodies conjugated to Texas Red (KDEL, red) or FITC (torsinA, green). Hoechst stain was used to visualize the nucleus. Scale bars, 10 μm. B, quantification shows the relative distribution of torsinA and KDEL in the NE versus the ER. Data represent mean ± S.E. (error bars) from at least three independent experiments. *, significantly different from the NE/ER ratio of torsinA WT (p < 0.05). C, NE preference of torsinA was determined by normalizing the NE/ER ratio of torsinA to the corresponding NE/ER ratio of KDEL in the same cells. Data represent mean ± S.E. from at least three independent experiments. *, significantly different from torsinA WT (p < 0.05).

References

    1. Bressman S. B., Fahn S., Ozelius L. J., Kramer P. L., Risch N. J. (2001) Arch. Neurol. 58, 681–682 - PubMed
    1. Walker R. H., Brin M. F., Sandu D., Good P. F., Shashidharan P. (2002) Neurology 58, 120–124 - PubMed
    1. Rostasy K., Augood S. J., Hewett J. W., Leung J. C., Sasaki H., Ozelius L. J., Ramesh V., Standaert D. G., Breakefield X. O., Hedreen J. C. (2003) Neurobiol. Dis. 12, 11–24 - PubMed
    1. Ozelius L. J., Hewett J. W., Page C. E., Bressman S. B., Kramer P. L., Shalish C., de Leon D., Brin M. F., Raymond D., Corey D. P., Fahn S., Risch N. J., Buckler A. J., Gusella J. F., Breakefield X. O. (1997) Nat. Genet. 17, 40–48 - PubMed
    1. Leung J. C., Klein C., Friedman J., Vieregge P., Jacobs H., Doheny D., Kamm C., DeLeon D., Pramstaller P. P., Penney J. B., Eisengart M., Jankovic J., Gasser T., Bressman S. B., Corey D. P., Kramer P., Brin M. F., Ozelius L. J., Breakefield X. O. (2001) Neurogenetics 3, 133–143 - PubMed

Publication types

Substances