Review
. 2009 Oct 6;6 Suppl 5(Suppl 5):S587-97.
doi: 10.1098/rsif.2009.0142.focus. Epub 2009 Jun 17.

Rastering strategy for screening and centring of microcrystal samples of human membrane proteins with a sub-10 microm size X-ray synchrotron beam

Affiliations
Review

Rastering strategy for screening and centring of microcrystal samples of human membrane proteins with a sub-10 microm size X-ray synchrotron beam

Vadim Cherezov et al. J R Soc Interface. .

Abstract

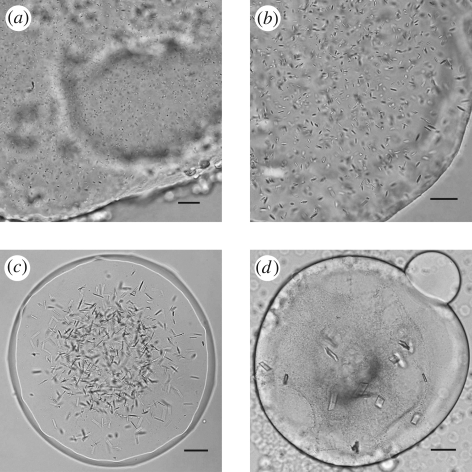
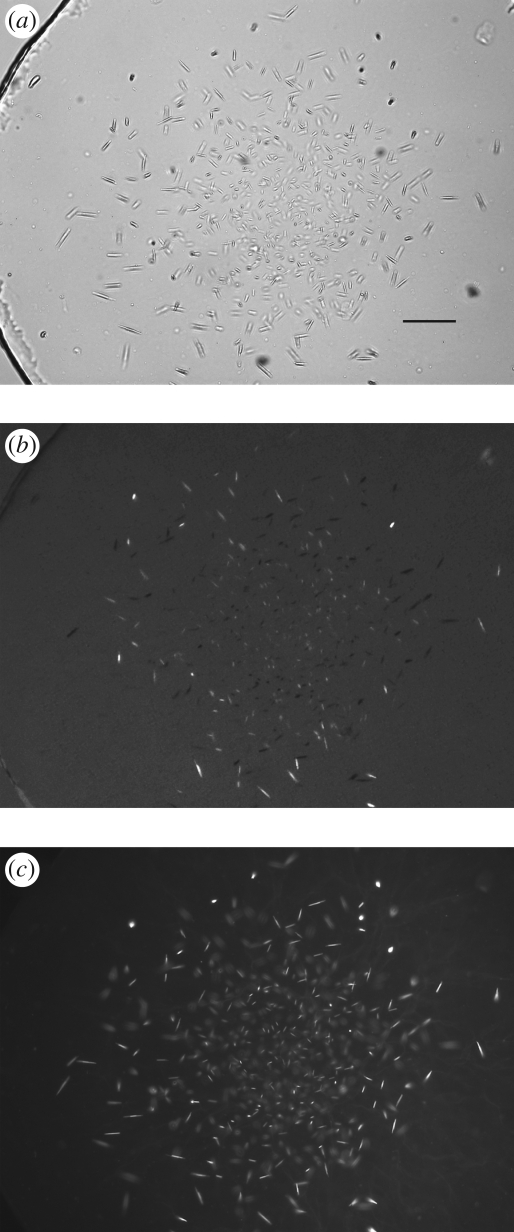
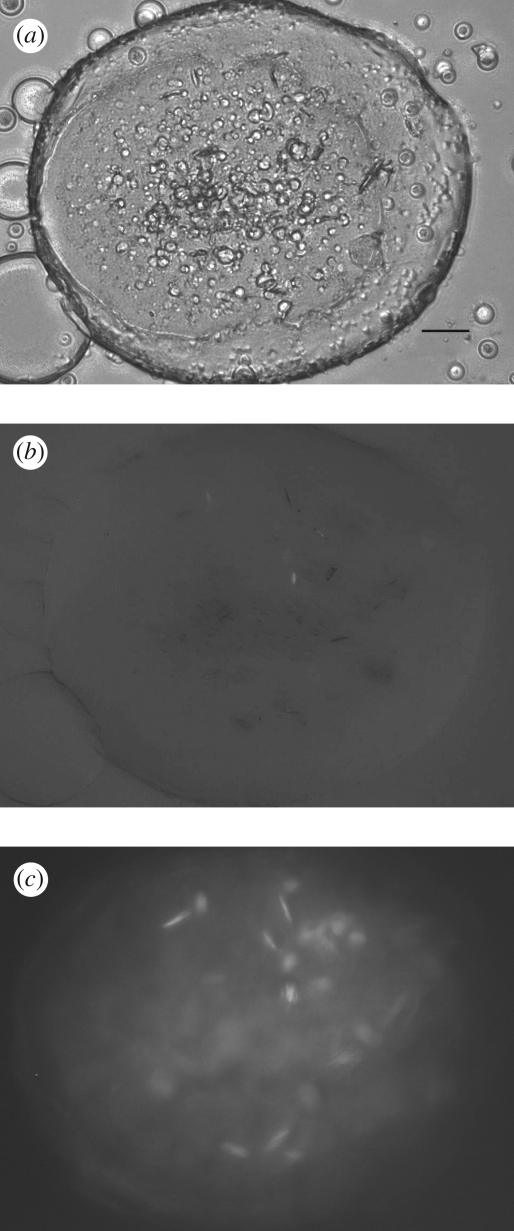
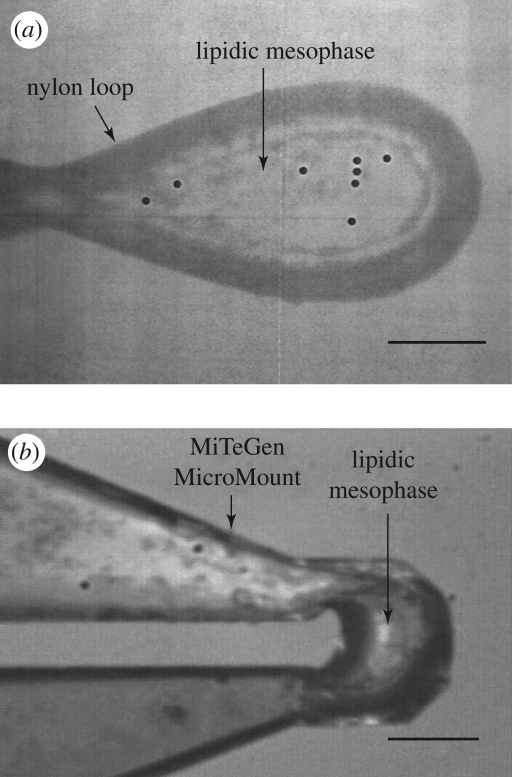
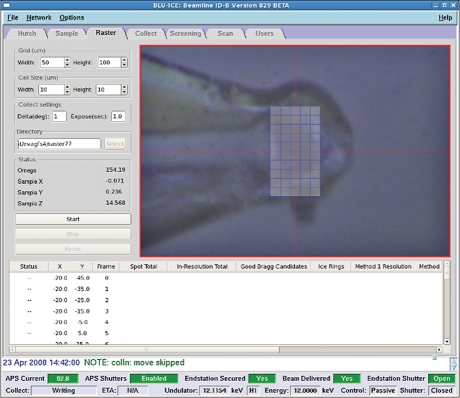
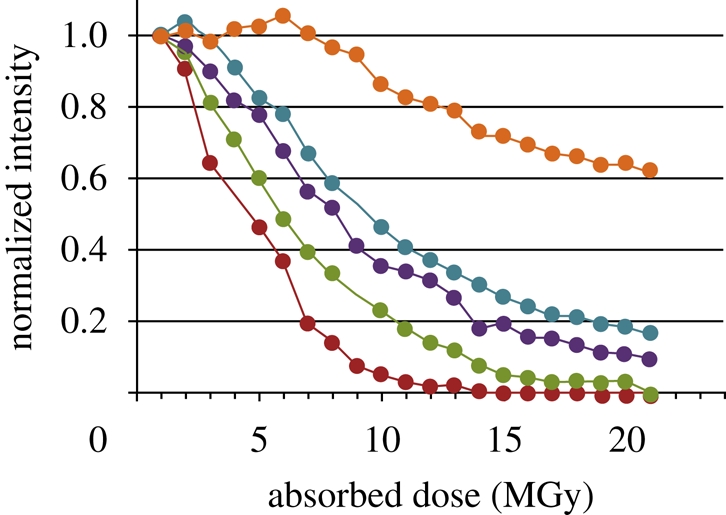
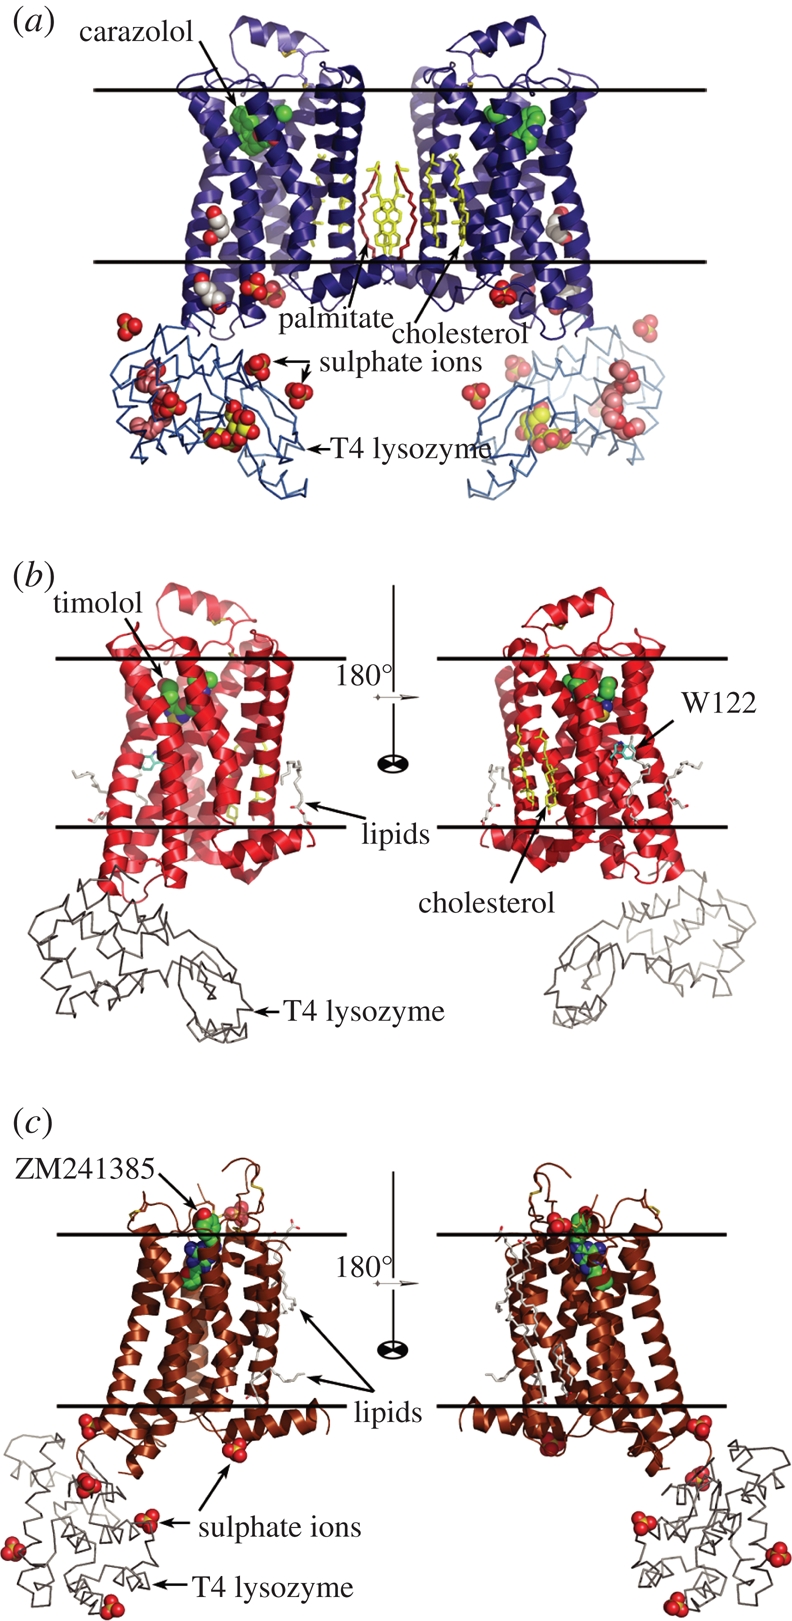
Crystallization of human membrane proteins in lipidic cubic phase often results in very small but highly ordered crystals. Advent of the sub-10 microm minibeam at the APS GM/CA CAT has enabled the collection of high quality diffraction data from such microcrystals. Herein we describe the challenges and solutions related to growing, manipulating and collecting data from optically invisible microcrystals embedded in an opaque frozen in meso material. Of critical importance is the use of the intense and small synchrotron beam to raster through and locate the crystal sample in an efficient and reliable manner. The resulting diffraction patterns have a significant reduction in background, with strong intensity and improvement in diffraction resolution compared with larger beam sizes. Three high-resolution structures of human G protein-coupled receptors serve as evidence of the utility of these techniques that will likely be useful for future structural determination efforts. We anticipate that further innovations of the technologies applied to microcrystallography will enable the solving of structures of ever more challenging targets.


Figures

Figure 1.
Figure 1.
Improvements in size and shape of β2AR-T4L crystals as the result of optimizations of crystallization conditions. (a) Initial crystals appearing as showers of microneedles with largest dimension of a few micrometres. (b) Crystals achieved after optimization of concentrations of the main precipitant (PEG 400), salt (sodium sulphate) and pH of the buffer. (c) Crystals obtained after optimization of the lipid additives. (d) Final crystals diffracting to high resolution. Scale bars, 25 µm (a,b); 50 µm (c,d).
Figure 2.
Figure 2.
Imaging of small A2AR-T4L crystals in LCP. (a) Image recorded with a Zeiss AxioImager microscope using a 10× objective and a bright-field illumination. LCP is very homogeneous and crystals are easily detected (scale bar, 25 µm). To confirm that the crystals are made of protein, the protein was labelled with a dye and fluorescence image was taken in (c). (b) Image recorded with a Zeiss AxioImager microscope using a 10× objective and crossed polarizers. Crystals show good birefringency, which also depends on their orientation in LCP. (c) Image recorded with a Zeiss AxioImager microscope using an epi-illumination with an excitation filter centred at 543 nm with a bandwidth of 22 nm and an emission filter with transmission between 575 and 640 nm. The protein was labelled with Cy3 succinimidyl ester at a trace ratio of below 1%. The fluorescence image provides a very good contrast even for very small, micrometre-size, crystals, confirming that the crystals contain protein.
Figure 3.
Figure 3.
Imaging of small β2AR-T4L crystals in LCP. (a) Image recorded with RockImager 1000 (Formulatrix) using a bright-field illumination. LCP contains many defects and irregularities scattering light and obscuring crystal detection. Scale bar, 50 µm. (b) Image recorded with RockImager 1000 using crossed polarizers. Crystals in this case display very low birefringency, which depends on their orientation, making them difficult to be detected. (c) UV-fluorescence image recorded with Korima UV microscope (excitation 280 nm, emission 350 nm). Slight protein precipitation and several protein crystals are clearly seen in this image.
Figure 4.
Figure 4.
Images of loops with harvested β2AR-T4L crystals under a cryo-stream recorded through the inline optics at the GM/CA beamline at APS. (a) A nylon loop with several optically invisible β2AR-T4L crystals embedded into a frozen lipidic mesophase. Scanning the loop with the minibeam revealed a distinct protein diffraction at locations marked with the black circles. (b) A MiTeGen MicroMount containing a small amount of lipidic mesophase with a single β2AR-T4L crystal. The crystal is optically invisible but can be easily located using the automated rastering procedure implemented at the GM/CA beamlines. Scale bars, 50 µm.
Figure 5.
Figure 5.
A screenshot of the automated rastering interface window in Blu-Ice. After centring the loop at the crosshair, the user defines a grid for rastering, selects exposure parameters at each cell of the grid and starts the scan. Collected diffraction frames are processed in real time using the program DISTL (Zhang et al. 2006) and the results are displayed in the window at the lower part of the screen.
Figure 6.
Figure 6.
Effect of radiation damage on the intensity of diffraction spots collected in different resolution shells (identified as different colours) from a crystal of A2AR-T4L. The crystal was exposed multiple times at the same orientation with the unattenuated minibeam using the 1° oscillation and 1 s exposure per frame. Each frame corresponds to an estimated radiation dose of 1 MGy absorbed by the crystal (the dose was calculated using the program RADDOSE; Murray et al. 2004). The crystal lost half of its diffraction intensity at 3 Å resolution after absorbing approximately 5 MGy. Red line, 3–3.1 Å; green line, 4–4.2 Å; violet line, 6–6.5 Å; blue line, 7.5–8 Å; orange line, 9–12 Å.
Figure 7.
Figure 7.
Crystal structures of (a) β2AR-T4L bound to carazolol (PDB ID 2RH1; Cherezov et al. 2007), (b) β2AR(E122W)-T4L bound to timolol (PDB ID 3D4S; Hanson et al. 2008) and (c) A2AR-T4L bound to ZM241385 (PDB ID 3EML; Jaakola et al. 2008). β2AR-T4L/carazolol crystallized as a parallel crystallographic dimer as shown in (a). Both β2AR(E122W)-T4L/timolol and A2AR-T4L/ZM241385 crystallized as monomers, and, therefore, two monomers rotated 180° around the vertical axis are shown in (b) and (c). Approximate locations of the lipid membrane boundaries are shown with two parallel black lines. Receptors are oriented with their extracellular side facing the top of the figure.

References

    1. Adams P. D., et al. 2002. PHENIX: building new software for automated crystallographic structure determination. Acta Crystallogr. D Biol. Crystallogr. 58, 1948–1954. (10.1107/S0907444902016657) - DOI - PubMed
    1. Benvenuti M., Mangani S. 2007. Crystallization of soluble proteins in vapor diffusion for x-ray crystallography. Nat. Protoc. 2, 1633–1651. (10.1038/nprot.2007.198) - DOI - PubMed
    1. Caffrey M. 2003. Membrane protein crystallization. J. Struct. Biol. 142, 108–132. (10.1016/S1047-8477(03)00043-1) - DOI - PubMed
    1. Caffrey M. 2009. Crystallizing membrane proteins for structure determination: use of lipidic mesophases. Annu. Rev. Biophys. 38, 29–51. (10.1146/annurev.biophys.050708.133655) - DOI - PubMed
    1. Carpenter E. P., Beis K., Cameron A. D., Iwata S. 2008. Overcoming the challenges of membrane protein crystallography. Curr. Opin. Struct. Biol. 18, 581–586. (10.1016/j.sbi.2008.07.001) - DOI - PMC - PubMed

Publication types

MeSH terms

Substances

LinkOut - more resources