. 2009 Jun 17;29(24):7869-76.
doi: 10.1523/JNEUROSCI.0113-09.2009.

The phase of ongoing EEG oscillations predicts visual perception

Affiliations

The phase of ongoing EEG oscillations predicts visual perception

Niko A Busch et al. J Neurosci. .

Abstract

Oscillations are ubiquitous in electrical recordings of brain activity. While the amplitude of ongoing oscillatory activity is known to correlate with various aspects of perception, the influence of oscillatory phase on perception remains unknown. In particular, since phase varies on a much faster timescale than the more sluggish amplitude fluctuations, phase effects could reveal the fine-grained neural mechanisms underlying perception. We presented brief flashes of light at the individual luminance threshold while EEG was recorded. Although the stimulus on each trial was identical, subjects detected approximately half of the flashes (hits) and entirely missed the other half (misses). Phase distributions across trials were compared between hits and misses. We found that shortly before stimulus onset, each of the two distributions exhibited significant phase concentration, but at different phase angles. This effect was strongest in the theta and alpha frequency bands. In this time-frequency range, oscillatory phase accounted for at least 16% of variability in detection performance and allowed the prediction of performance on the single-trial level. This finding indicates that the visual detection threshold fluctuates over time along with the phase of ongoing EEG activity. The results support the notion that ongoing oscillations shape our perception, possibly by providing a temporal reference frame for neural codes that rely on precise spike timing.


Figures

Figure 1.
Figure 1.
Illustration of the phase bifurcation index with hypothetical data. The index is computed as Φ = (ITC1 − ITCall) × (ITC2 − ITCall), where ITC1,2,all is the intertrial coherence in conditions 1 and 2 and in both conditions combined. Each line segment represents a trial, with its angle representing phase at the frequency and time point of interest. The left circles illustrate global phase distributions, while the right circles show the two experimental conditions separately. A, Both conditions are phase locked at opposite angles. As a result, the ITC of both conditions combined is close to zero, resulting in a strong positive Φ. This is equivalent to the hypothesis that hits and misses are each associated with different phase angles. B, The null hypothesis states that both conditions are randomly distributed, resulting in a Φ close to zero. C, Only one condition is phase locked, and the other is randomly distributed. The resulting ITC of both conditions is stronger than the ITC of condition 1, but smaller than the ITC of condition 2, resulting in a negative Φ. This situation is expected during the ERP time range, where an ERP is present only for detected stimuli. D, Both conditions are strongly phase locked at the same phase angle; the resulting Φ is close to zero.
Figure 2.
Figure 2.
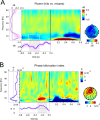
Raw effects of oscillatory power and phase. A, Difference in spectral power in decibels between hits and misses, averaged across channels and subjects. Negative values indicate stronger power for misses. Left inset shows power difference averaged across time points in the prestimulus window (shaded areas: SEM). The main difference is found in the 6–12 Hz frequency range. Bottom inset, Power difference averaged across frequencies in this range, with a maximally negative difference in the prestimulus time range between −600 and −300 ms (gray shaded area). The topography shows the distribution of the power difference from 6 to 12 Hz and from −600 to −300 ms preceding stimulus onset. B, Phase bifurcation index (Φ), averaged across all channels and subjects. Positive values indicate that phase distributions are locked to different phase angles for hits and misses (e.g., in the prestimulus time range), while negative values indicate that only one condition is phase locked (e.g., phase locking exclusively for hits in the ERP time range). Left inset shows Φ averaged across all time points in the prestimulus window (vertical lines represent the 95% confidence interval). Bottom inset, Φ averaged across frequencies between 6 and 10 Hz (shaded area: SE). Phase bifurcation is strongest from −300 to −50 ms preceding stimulus onset (gray shaded area). The topography shows the distribution of Φ from 6 to 10 Hz and from −300 to −50 ms preceding stimulus onset.
Figure 3.
Figure 3.
Relation between perception and oscillatory activity. A, Statistical significance of the power difference at channel Fz between hits and misses (left panel), evaluated with a resampling test. Alpha power (6–12 Hz) preceding stimulus onset was significantly stronger for misses than for hits. The color map represents uncorrected p values and the white outline delimits significant effects corresponding to an FDR of 5%. The right panel shows the relationship between spectral power in the alpha band (8.2 Hz) at −492 ms and performance after single trials were pooled in 10 power bins. The horizontal line indicates average performance (standardized to 1) across all bins. Error bars represent SEM. Performance is superior on trials with lowest alpha power (1-way ANOVA, p < 0.0165). B, Statistical significance of phase bifurcation between hits and misses at channel Fz (left panel); axes and conventions are as in A. At ∼7 Hz and −120 ms prestimulus, hits and misses are associated with different phase angles. Top inset, The circular histograms of mean phase angles at 7.1 Hz and 120 ms for hits and misses across participants. Phases were pooled into four phase bins. The distance from the origin indicates the number of subjects falling within a bin, and the angles indicate the lower bound of each phase bin. Bottom inset, Close-up on the 55 time–frequency points with significant phase bifurcation that satisfy an FDR of 5%. The right panel shows the relationship between phase (at 7.1 Hz; −120 ms) and standardized performance after phases were aligned for each subject so that the optimal phase corresponds to a zero phase angle. Performance declines to a minimum at the opposite phase angle (1-way ANOVA, p < 0.01).

Comment in

References

    1. Arieli A, Sterkin A, Grinvald A, Aertsen A. Dynamics of ongoing activity: explanation of the large variability in evoked cortical responses. Science. 1996;273:1868–1871. - PubMed
    1. Babiloni C, Brancucci A, Del Percio C, Capotosto P, Arendt-Nielsen L, Chen ACN, Rossini PM. Anticipatory electroencephalography alpha rhythm predicts subjective perception of pain intensity. J Pain. 2006;7:709–717. - PubMed
    1. Barry RJ, Rushby JA, Johnstone SJ, Clarke AR, Croft RJ, Lawrence CA. Eventrelated potentials in the auditory oddball as a function of EEG alpha phase at stimulus onset. Clin Neurophysiol. 2004;115:2593–2601. - PubMed
    1. Başar E, Rahn E, Demiralp T, Schürmann M. Spontaneous EEG theta activity controls frontal visual evoked potential amplitudes. Electroencephalogr Clin Neurophysiol. 1998;108:101–109. - PubMed
    1. Benjamini Y, Hochberg Y. Controlling the false discovery rate: a practical and powerful approach to multiple testing. J R Stat Soc Series B. 1995;57:289–300.

Publication types

LinkOut - more resources