

Social inequality in walking speed in early old age in the Whitehall II study
- PMID: 19535784
- PMCID: PMC4851984
- DOI: 10.1093/gerona/glp078
Social inequality in walking speed in early old age in the Whitehall II study
Abstract
Background: We investigated social inequalities in walking speed in early old age.
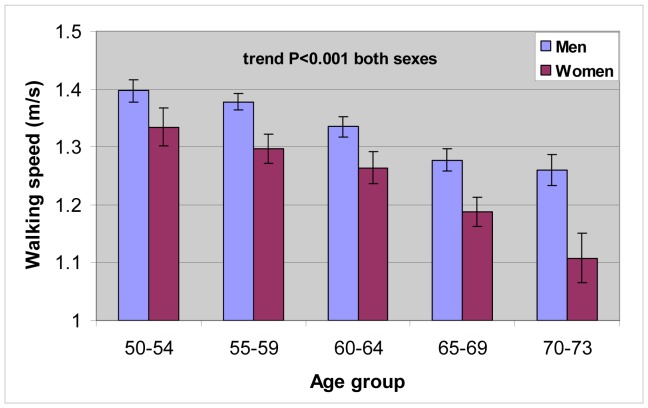
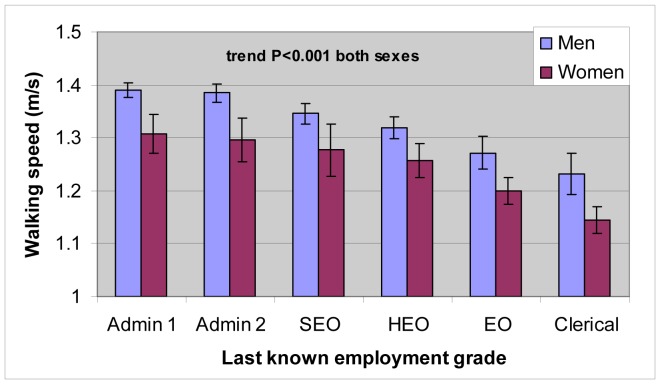
Methods: Walking speed was measured by timed 8-ft (2.44 m) test in 6,345 individuals, with mean age of 61.1 (SD 6.0) years. Current or last known civil service employment grade defined socioeconomic position.
Results: Mean walking speed was 1.36 (SD 0.29) m/s in men and 1.21 (SD 0.30) in women. Average age- and ethnicity-adjusted walking speed was approximately 13% higher in the highest employment grade compared with the lowest. Based on the relative index of inequality (RII), the difference in walking speed across the social hierarchy was 0.15 m/s (95% confidence interval [CI] 0.12-0.18) in men and 0.17 m/s (0.12-0.22) in women, corresponding to an age-related difference of 18.7 (13.6-23.8) years in men and 14.9 (9.9-19.9) years in women. The RII for slow walking speed (logistic model for lowest sex-specific quartile vs others) adjusted for age, sex, and ethnicity was 3.40 (2.64-4.36). Explanatory factors for the social gradient in walking speed included Short-Form 36 physical functioning, labor market status, financial insecurity, height, and body mass index. Demographic, psychosocial, behavioral, biologic, and health factors in combination accounted for 40% of social inequality in walking speed.
Conclusion: Social inequality in walking speed is substantial in early old age and reflects many factors beyond the direct effects of physical health.
Figures
References
-
- Office for National Statistics. National Statistics website. 2007. Trends in Life Expectancy by social class 1972–2005.
-
- Huisman M, Kunst AE, Mackenbach JP. Socioeconomic inequalities in morbidity among the elderly; a European overview. soc sci med. 2003;57(5):861–873. - PubMed
-
- Minkler M, Fuller-Thomson E, Guralnik JM. Gradient of disability across the socioeconomic spectrum in the United States. N Engl J Med. 2006;355(7):695–703. - PubMed
