. 2009 Jul 23;460(7254):479-86.
doi: 10.1038/nature08170. Epub 2009 Jun 17.

Argonaute HITS-CLIP decodes microRNA-mRNA interaction maps

Affiliations

Argonaute HITS-CLIP decodes microRNA-mRNA interaction maps

Sung Wook Chi et al. Nature. .

Abstract

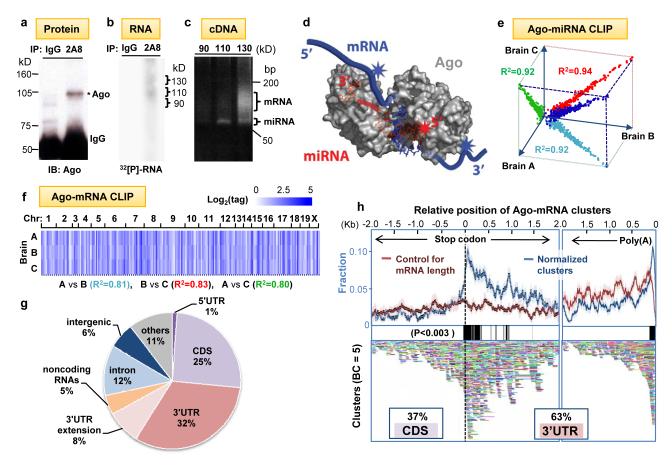
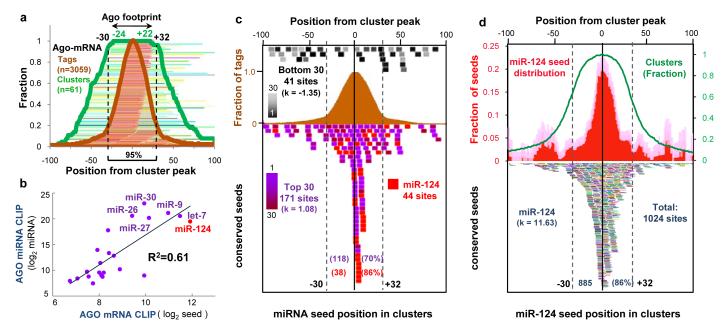
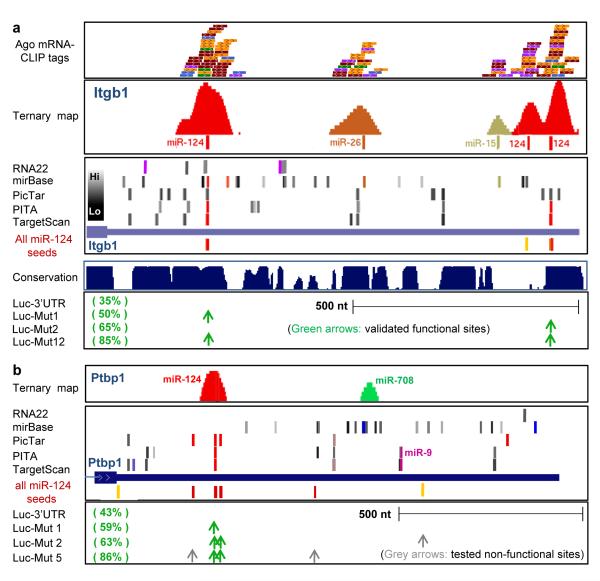
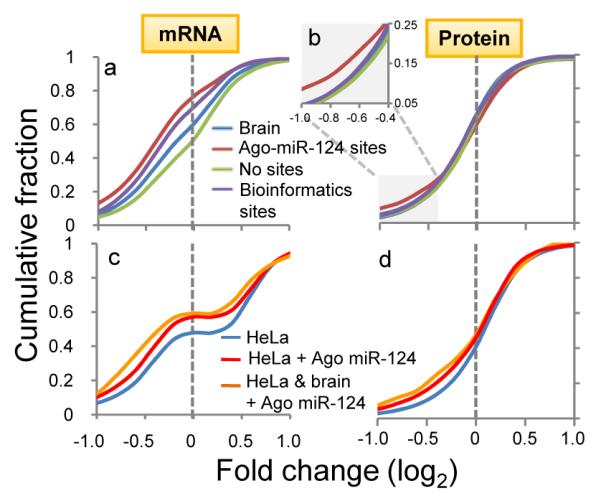
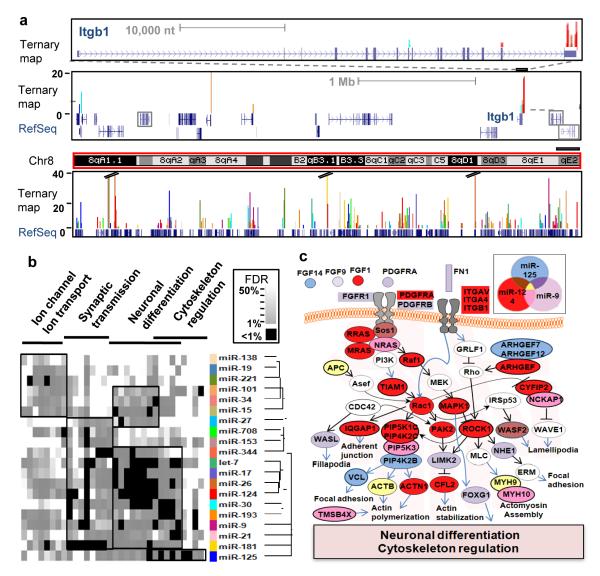
MicroRNAs (miRNAs) have critical roles in the regulation of gene expression; however, as miRNA activity requires base pairing with only 6-8 nucleotides of messenger RNA, predicting target mRNAs is a major challenge. Recently, high-throughput sequencing of RNAs isolated by crosslinking immunoprecipitation (HITS-CLIP) has identified functional protein-RNA interaction sites. Here we use HITS-CLIP to covalently crosslink native argonaute (Ago, also called Eif2c) protein-RNA complexes in mouse brain. This produced two simultaneous data sets-Ago-miRNA and Ago-mRNA binding sites-that were combined with bioinformatic analysis to identify interaction sites between miRNA and target mRNA. We validated genome-wide interaction maps for miR-124, and generated additional maps for the 20 most abundant miRNAs present in P13 mouse brain. Ago HITS-CLIP provides a general platform for exploring the specificity and range of miRNA action in vivo, and identifies precise sequences for targeting clinically relevant miRNA-mRNA interactions.


Figures

Fig. 1
Fig. 1. Argonaute HITS-CLIP
(a) Immunoblot (IB) analysis of Ago immunoprecipitates (IP) from P13 mouse neocortex using pre-immune IgG as a control or anti-Ago monoclonal antibody 2A8 were blotted with 7G1-1* antibody (Supplementary Methods). (b) Autoradiogram of 32P-labeled RNA crosslinked to mouse brain Ago purified by IP. RNA-protein complexes of ∼110 kD and ∼ 130 kD are seen with 2A8 but not control IP. (c) PCR products amplified after linker (36 nt) ligation to RNA products excised from (b). Products from the 110 kD RNA-protein complex were ∼22 nt miRNAs, and those from 130 kD complexes were predominantly mRNAs. (d) Illustration showing proposed interpretation of data in (c). Ago (drawn based on structure 3F73 in PDB) binds in a ternary complex to both miRNA and mRNA, with sufficiently close contacts to allow UV-crosslinking to either RNA; mRNA tags will be in the immediate vicinity of miRNA binding sites. (e-f) Reproducibility of all Ago-miRNA tags (e; graphed as log2(normalized miRNA frequency) per brain) or all tags within Ago-mRNA clusters (f; see Supplementary Figs. 2-3). We estimated that sequencing depth was near saturation (Supplementary Fig. 16). (g) Location of reproducible Ago-mRNA tags (tags in clusters; BC≥2) in the genome. Annotations are from RefSeq; ”others” are unannotated EST transcripts, non-coding RNAs are from lincRNAs or FANTOM3. (h) Top panel: The position of robust Ago-mRNA clusters (BC = 5) in transcripts is plotted relative to the stop codon and 3′ end (presumptive poly(A) site, as indicated). Data is plotted as normalized density relative to transcript abundance for Ago-mRNA clusters (blue) or control clusters (red), (standard deviations are shown in light colors; see Supplementary Methods). Regions with significant enrichment relative to control are indicated with black bars (> 3 standard deviations; P<0.003). Cluster enrichment ∼1kb downstream from stop codon appears to be due to a large number of transcripts with ∼1kb 3′ UTRs (data not shown). Bottom panel: All individual clusters (BC=5) are shown (each is a different color).
Fig. 2
Fig. 2. Distribution of mRNA tags correlates with seed sequences of miRNAs from Ago CLIP
(a) Ago-mRNA cluster width and peaks. The peaks of 61 robust clusters (BC = 5, peak height >30, with single peaks) were determined, and the position of tags (brown lines and fraction plotted as brown graph) and width of individual clusters (green lines and fraction plotted as green graph) are shown relative to the peaks (Supplementary Methods). The minimum region of overlap of all clusters (100%) was within -24 and +22 nt of cluster peaks, and ≥ 95% were within -30 and +32 nt, suggesting that the Ago footprint on mRNA spans 62 nt (or, more stringently, 46 nt). (b) A linear regression model was used to compare miRNA seed matches enriched in the stringent Ago footprint region with the frequency of miRNAs experimentally determined by Ago-miRNA HITS-CLIP (see also Supplementary Fig. 9). (c) The position of conserved core seed matches (position 2-7) from the top 30 Ago-bound miRNAs (independent of peak height; purple colors, including miR-124, red; or, bottom 30 miRNAs, expressed at extremely low levels in brain (Supplementary Fig. 2); black to gray colors) are plotted relative to the peak of 134 robust clusters (BC = 5, peak height >30). 118 of 171 seed matches are within the Ago 62 nt footprint (d) The position of conserved miR-124 seed matches (bottom panel; each is represented by a different color) were plotted relative to the peak position of all Ago-mRNA clusters (BC ≥ 2). Top panel; distribution of mir-124 seed matches (plotted relative to cluster peak, normalized to number of clusters; red graph); pale color indicates standard deviation. Excess kurtosis (k) indicates that seed sites are present in a sharp peak relative to a normal distribution.
Fig. 3
Fig. 3. Ago-miRNA ternary clusters in validated miR-124 mRNA targets
(a) Ago—mRNA CLIP tags (top panel: raw tags, one color per biologic replicate: second panel: ternary map of Ago-mRNA normalized clusters around top predicted miRNA sites) compared with predicted miRNA sites (using indicated algorithms) for the 3′ UTR of Itgb1 (third panel, see Supplementary Methods; colors indicate predicted top 20 miRNAs as in Fig. 5; grey bars indicate miRNAs ranking below the top 20 (per heat-map) in Ago-miRNA CLIP). All predicted miR-124 6-8 mer seeds (conserved (red) or non-conserved (yellow) sites) are shown. Bottom panel shows data from luciferase assays in which mutagenesis of predicted miR-124 seeds at the indicated positions had the indicated effects on restoring from miR-124 mediated suppression (35% of baseline luciferase levels). (b) Ago-miRNA ternary maps compared with previously reported functional data for Ptbp1; see Supplementary Fig. 10 for maps of Ctdsp1 and Vamp3.
Fig. 4
Fig. 4. Meta-analysis of Ago-mRNA clusters in large-scale screens of miR-124 regulated targets
(a) Transcripts with predicted (conserved) miR-124 seeds (purple line) showed miR-124 suppression relative to all transcripts expressed in brain and cell lines (blue line) or those with no miR-124 seed sequences (green line). Transcripts with Ago-miR-124 ternary clusters (containing both miR-124 seed sequences and Ago-mRNA CLIP tags; red line) showed further miR-124 suppression. (b) Similar results were seen when analyzing miR-124 dependent protein suppression (identified by SILAC), with discrimination by the presence of Ago-miR-124 ternary clusters especially evident where there were smaller numbers of transcripts showing larger changes (log2<-0.4; inset). (c) Transcripts expressed in miR-124 transfected HeLa cells that harbor new Ago-miR-124 clusters (red line; or a subset of transcripts also harboring Ago-miR-124 clusters in mouse brain; yellow line), compared with previous analysis of regulated transcripts in miR-124 transfected HeLa cells. (d) As in (c), plotted for predicted protein levels, compared with prior data.
Fig. 5
Fig. 5. Ago-miRNA ternary maps
(a) Genome-wide views of Ago-miRNA ternary maps for the top 20 miRNAs from Ago HITS-CLIP (colors represent individual miRNA targets as indicated in (b)) are shown for the Itgb1 gene (top panel), the local gene region (middle panel; all transcripts are expressed in P13 brain except those outlined in grey boxes), showing tags in neighboring 3′ UTRs, and for all of chromosome 8 (bottom panel). (b) Heat map derived from gene ontology (GO) analysis of transcripts identified as targets of each of the top 20 miRNAs. Tree shows the hierarchical clustering of miRNAs based on GO (Supplementary Methods). Significant clusters are outlined with black boxes (see Supplementary Fig. 12). (c) Ago HITS-CLIP targets are shown for the most significant pathways (neuronal differentiation/cytoskeleton regulation; based on FDR; Fig. 5b) for miR-124, miR-9 and miR-125 in mouse brain. Actin cytoskeleton pathways are shown based on KEGG database (http://www.genome.jp/kegg/).

References

    1. Filipowicz W, Bhattacharyya SN, Sonenberg N. Mechanisms of post-transcriptional regulation by microRNAs: are the answers in sight? Nat Rev Genet. 2008;9:102–114. - PubMed
    1. Sharp PA. The centrality of RNA. Cell. 2009;136:577–580. - PubMed
    1. Ambros V. The functions of animal microRNAs. Nature. 2004;431:350–355. - PubMed
    1. Bartel DP. MicroRNAs: genomics, biogenesis, mechanism, and function. Cell. 2004;116:281–297. - PubMed
    1. He L, Hannon GJ. MicroRNAs: small RNAs with a big role in gene regulation. Nat Rev Genet. 2004;5:522–531. - PubMed

Publication types

Associated data