. 2009:5:274.
doi: 10.1038/msb.2009.31. Epub 2009 Jun 16.

Genome-wide allele- and strand-specific expression profiling

Affiliations

Genome-wide allele- and strand-specific expression profiling

Julien Gagneur et al. Mol Syst Biol. 2009.

Abstract

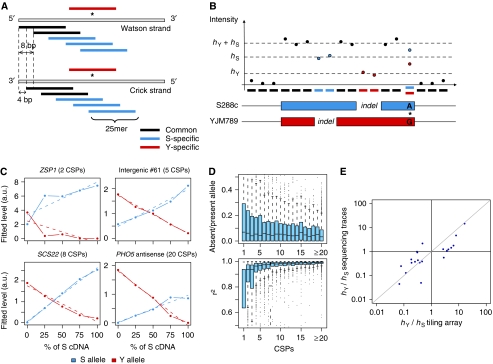
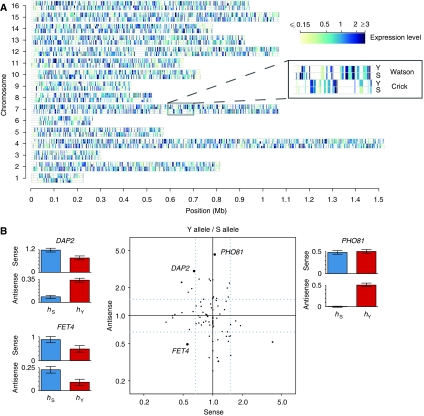
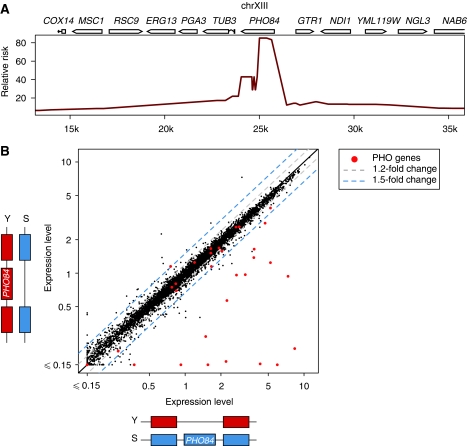
Recent reports have shown that most of the genome is transcribed and that transcription frequently occurs concurrently on both DNA strands. In diploid genomes, the expression level of each allele conditions the degree to which sequence polymorphisms affect the phenotype. It is thus essential to quantify expression in an allele- and strand-specific manner. Using a custom-designed tiling array and a new computational approach, we piloted measuring allele- and strand-specific expression in yeast. Confident quantitative estimates of allele-specific expression were obtained for about half of the coding and non-coding transcripts of a heterozygous yeast strain, of which 371 transcripts (13%) showed significant allelic differential expression greater than 1.5-fold. The data revealed complex allelic differential expression on opposite strands. Furthermore, combining allele-specific expression with linkage mapping enabled identifying allelic variants that act in cis and in trans to regulate allelic expression in the heterozygous strain. Our results provide the first high-resolution analysis of differential expression on all four strands of an eukaryotic genome.


Conflict of interest statement

The authors declare that they have no conflict of interest.

Figures

Figure 1
Figure 1
Measuring allelic expression on a tiling array. (A) The array contains 25-mer probes (black and blue) that tile both strands of the genome of S288c with a probe offset of 8 bp and a 4-bp shift between the two strands. The array also contains probes (red) complementary to the YJM789 sequence for polymorphic regions, as shown here for a SNP marked by an asterisk. (B) Modeling the hybridization intensity. Consider a two-allelic transcript with two indels and one SNP as shown in the lower part. The S allele is at expression level hS and the Y allele at hY. Hybridization intensities of the common probes are ideally expected to be proportional to the sum of the two expression levels. Intensities measured for the probes specific to the S or Y alleles are expected to be proportional to their expression levels, hS or hY, respectively. Owing to cross-hybridization, probes with sequence highly similar to the other allele yield higher intensities (shown here for a SNP). These properties are modeled in equation (1) (Materials and methods). (C) Inferred expression level of transcripts in the mixture series. The circles show inferred expression levels for the S allele (blue) and the Y allele (red). Dotted lines mark linear regression. The quality, in terms of both linear behavior and monoallelic calls, improves when moving from ZSP1 with only two centered specific probes (CSPs) to the antisense of PHO5 with 20 CSPs. (D) Monoallelic calls and linearity of the method. Boxplots of the ratios of inferred expression level of the absent allele over the present allele as a function of the number CSPs (top). In these parental samples, the true value is known to be 0 and the ratio is expected to tend to 0 with increasing CSPs. Boxplots of the r2 coefficient of the linear fit for expressed alleles as a function of the number CSPs (bottom). Perfect linearity should give r2 of 1. (E) Comparison of allelic expression ratios from tiling array and sequencing traces. For 21 transcripts (see supplementary table VII), allelic expression ratios inferred from tiling array analysis (X-axis, log scale) plotted against allelic expression ratios inferred from sequencing traces (Y-axis, log scale). The y=x line (gray) is provided as a reference.
Figure 2
Figure 2
Expression profiles across four strands of a diploid genome. (A) Expression levels of all transcripts are shown as colored rectangles positioned with their coordinates on either of the four strands (Y or S, Watson or Crick). One region on chromosome VII is enlarged in the inset. Data shown in this figure are available in supplementary table I. (B) Allele-specific expression of sense–antisense transcript pairs. Scatter plot of allelic expression ratios (center panel) for sense (X-axis, log scale) versus antisense (Y-axis, log scale). Dotted blue lines show 1.5-fold expression differences. Pairs mentioned in the text are labeled and highlighted (bold dots). Allelic expression measurements of three sense–antisense pairs (bar plots) show instances of significant ADE (FDR <0.05) for an anti-correlated pair (DAP2), a correlated pair, (FET4), and a pair with strong antisense ADE but no difference in sense expression levels (PHO81).
Figure 3
Figure 3
The genetic basis of trans-regulation of the PHO pathway in the hybrid. (A) Linkage mapping. Relative risk of arsenate resistance for segregants carrying the S allele compared with the Y allele, plotted for markers across a 20-kb region on chromosome XIII around PHO84. (B) Scatter plot of transcript expression levels for the hybrid strain carrying the PHO84-S allele only (X-axis, log scale) versus the hybrid strain carrying the PHO84-Y allele only (Y-axis, log scale). Dotted lines show fold differences of 1.2 (gray) and 1.5 (blue). The majority of the PHO pathway genes (red dots) show differential expression between the two strains showing that the Y allele acts dominantly in the hybrid to repress the PHO pathway.

References

    1. Birney E, Stamatoyannopoulos JA, Dutta A, Guigo R, Gingeras TR, Margulies EH, Weng Z, Snyder M, Dermitzakis ET, Thurman RE, Kuehn MS, Taylor CM, Neph S, Koch CM, Asthana S, Malhotra A, Adzhubei I, Greenbaum JA, Andrews RM, Flicek P et al. (2007) Identification and analysis of functional elements in 1% of the human genome by the ENCODE pilot project. Nature 447: 799–816 - PMC - PubMed
    1. Bjornsson H, Albert T, Ladd-Acosta C, Green R, Rongione M, Middle C, Irizarry R, Broman K, Feinberg A (2008) SNP-specific array-based allele-specific expression analysis. Genome Res 18: 771–779 - PMC - PubMed
    1. Bolstad BM, Irizarry RA, Astrand M, Speed TP (2003) A comparison of normalization methods for high density oligonucleotide array data based on variance and bias. Bioinformatics 19: 185–193 - PubMed
    1. Bray NJ, Buckland PR, Owen MJ, O'Donovan MC (2003) Cis-acting variation in the expression of a high proportion of genes in human brain. Hum Genet 113: 149–153 - PubMed
    1. Camblong J, Iglesias N, Fickentscher C, Dieppois G, Stutz F (2007) Antisense RNA stabilization induces transcriptional gene silencing via histone deacetylation in S. cerevisiae. Cell 131: 706–717 - PubMed

MeSH terms

Substances

LinkOut - more resources