. 2009:5:275.
doi: 10.1038/msb.2009.26. Epub 2009 Jun 16.

An atlas of chaperone-protein interactions in Saccharomyces cerevisiae: implications to protein folding pathways in the cell

Affiliations

An atlas of chaperone-protein interactions in Saccharomyces cerevisiae: implications to protein folding pathways in the cell

Yunchen Gong et al. Mol Syst Biol. 2009.

Abstract

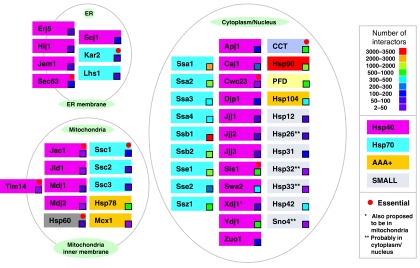
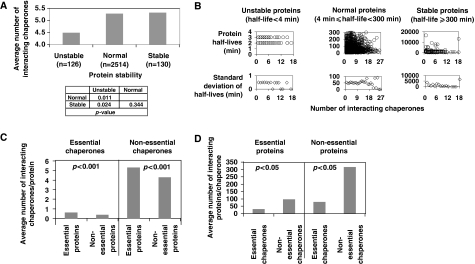
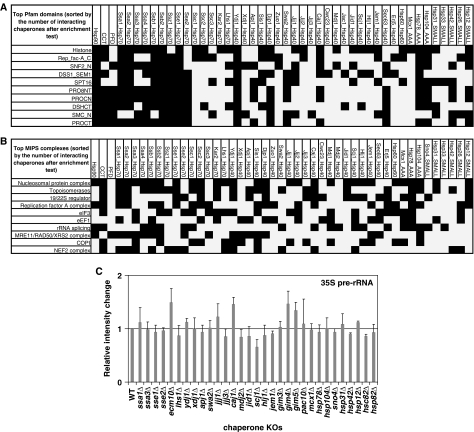
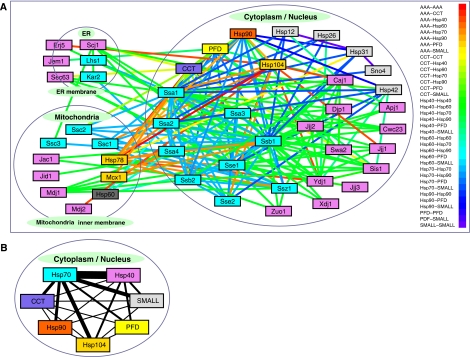
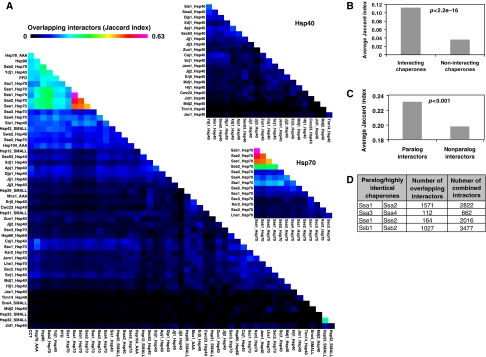
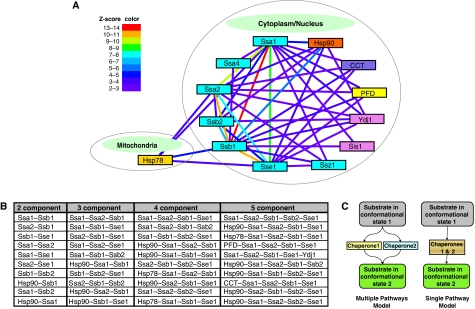
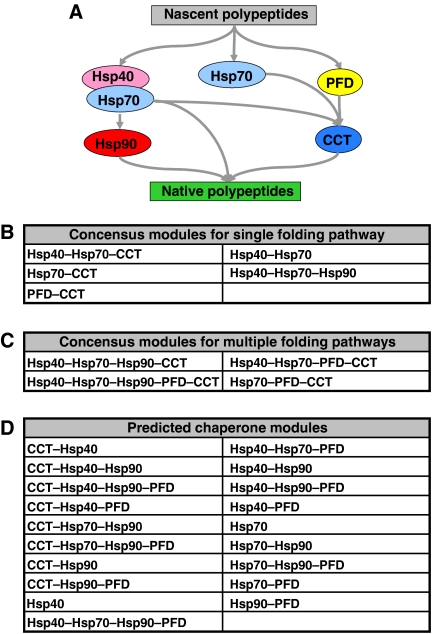
Molecular chaperones are known to be involved in many cellular functions, however, a detailed and comprehensive overview of the interactions between chaperones and their cofactors and substrates is still absent. Systematic analysis of physical TAP-tag based protein-protein interactions of all known 63 chaperones in Saccharomyces cerevisiae has been carried out. These chaperones include seven small heat-shock proteins, three members of the AAA+ family, eight members of the CCT/TRiC complex, six members of the prefoldin/GimC complex, 22 Hsp40s, 1 Hsp60, 14 Hsp70s, and 2 Hsp90s. Our analysis provides a clear distinction between chaperones that are functionally promiscuous and chaperones that are functionally specific. We found that a given protein can interact with up to 25 different chaperones during its lifetime in the cell. The number of interacting chaperones was found to increase with the average number of hydrophobic stretches of length between one and five in a given protein. Importantly, cellular hot spots of chaperone interactions are elucidated. Our data suggest the presence of endogenous multicomponent chaperone modules in the cell.


Conflict of interest statement

The authors declare that they have no conflict of interest.

Figures

Figure 1
Figure 1
Overview of chaperones and their interactor numbers. 50 chaperones/chaperone complexes in yeast are shown arranged according to their subcellular localization. The essentiality and types of chaperones are indicated together with the number of identified interactors.
Figure 2
Figure 2
Characterization of chaperone interactors. (A) The average number of chaperones interacting with proteins of different half-lives. (B) Top panels show a plot of protein half-lives versus the number of interacting chaperones for the ‘unstable', ‘stable', and ‘normal' groups of proteins. Lower panels show the s.d. of protein half-lives versus the number of interacting chaperones. (C) A comparison of the average number of interacting chaperones per protein on the basis of essentiality. (D) A comparison of the average number of interacting proteins per chaperone on the basis of essentiality. In (A, C, D) statistical significance is on the basis of the Mann–Whitney test.
Figure 3
Figure 3
Interaction of chaperones with Pfam domains and protein complexes. (A) The top ten Pfam domains enriched in chaperone interactors. (B) The top ten MIPS complexes enriched in chaperone interaction. In (A) and (B), a hypergeometric distribution was assumed to assess enrichment (refer to Materials and Methods). (C) Results of the northern blot analyses for 35S pre-rRNA from 31 different chaperone knockout strains grown at 30°C in YPD media for 3 days. Data shown are averages of three repeats. Bands were normalized to the band corresponding to U2 RNA and then divided by the corresponding value for the wildtype (Zhao et al, 2008).
Figure 4
Figure 4
Chaperone interaction network on the basis of TAP-tag interactions between chaperones. (A) Chaperone interaction network on the basis of chaperone–chaperone TAP-based interactions. (B) Same as the network shown in (A) but for cytoplasmic chaperones grouped into seven families. The thickness of the edges represents the number of interactions between the members of the families. Source data is available for this figure at www.nature.com/msb.
Figure 5
Figure 5
Interactor overlap among chaperones. (A) A heat map highlighting the overlap of non-chaperone interactors among the 50 chaperones/chaperone complexes using the Jaccard indices. (B) Comparison of the number of interacting chaperones versus non-interacting chaperones on the basis of the Jaccard index derived from several non-chaperone interactors. (C) The relationship between paralog and non-paralog interactors on the basis of chaperone overlap. (D) Shown are the numbers of interactor overlap between paralog/highly identical chaperones. The identities between chaperones in each pair are as follows: Ssa1–Ssa2 98.2%, Ssa3–Ssa4 86.9%, Sse1–Sse2 77.2%, and Ssb1–Ssb2 99.4%. In (B and C) statistical significance is on the basis of the Mann–Whitney test.
Figure 6
Figure 6
Chaperone modules based on interactor overlap. (A) Two-component chaperone modules are shown. Two chaperones in a module are linked with an edge. Edge color represents significance on the basis of the Z-score derived from interactor overlap. (B) A list of the top ten chaperone modules containing 2–5 components. The modules are sorted from top to bottom on the basis of Z-scores. For each module, chaperones are listed alphabetically. (C) The schematics for the single pathway and multiple pathways models. Source data is available for this figure at www.nature.com/msb.
Figure 7
Figure 7
Chaperone modules in an experimental folding pathway model. (A) A generally accepted experimental model for chaperone-mediated protein folding pathway in the cell cytoplasm (Young et al, 2004). (B) 5 single pathway modules derived from the model. (C) Four multiple pathway modules derived from the model. (D) A list of the 19 new modules predicted to be present in the experimental model on the basis of our data. In (B), (C), and (D), the chaperones in each module are ordered from left to right on the basis of the model in (A).

References

    1. Albanese V, Yam AY, Baughman J, Parnot C, Frydman J (2006) Systems analyses reveal two chaperone networks with distinct functions in eukaryotic cells. Cell 124: 75–88 - PubMed
    1. Altschul SF, Gish W, Miller W, Myers EW, Lipman DJ (1990) Basic local alignment search tool. J Mol Biol 215: 403–410 - PubMed
    1. Andreeva A, Howorth D, Chandonia JM, Brenner SE, Hubbard TJ, Chothia C, Murzin AG (2008) Data growth and its impact on the SCOP database: new developments. Nucleic Acids Res 36: D419–D425 - PMC - PubMed
    1. Ashburner M, Ball CA, Blake JA, Botstein D, Butler H, Cherry JM, Davis AP, Dolinski K, Dwight SS, Eppig JT, Harris MA, Hill DP, Issel-Tarver L, Kasarskis A, Lewis S, Matese JC, Richardson JE, Ringwald M, Rubin GM, Sherlock G (2000) Gene ontology: tool for the unification of biology. The Gene Ontology Consortium. Nat Genet 25: 25–29 - PMC - PubMed
    1. Bader GD, Hogue CW (2002) Analyzing yeast protein-protein interaction data obtained from different sources. Nat Biotechnol 20: 991–997 - PubMed

Publication types

MeSH terms

Substances