. 2009:5:285.
doi: 10.1038/msb.2009.42. Epub 2009 Jun 16.

Prevalence of transcription promoters within archaeal operons and coding sequences

Affiliations

Prevalence of transcription promoters within archaeal operons and coding sequences

Tie Koide et al. Mol Syst Biol. 2009.

Abstract

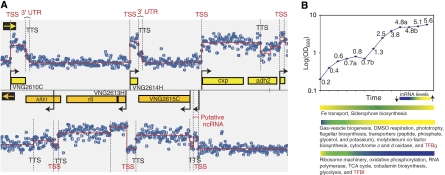
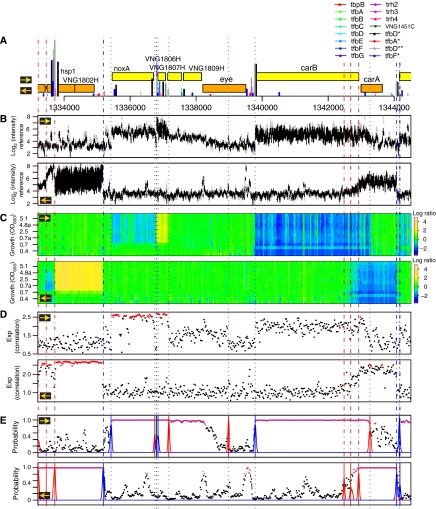
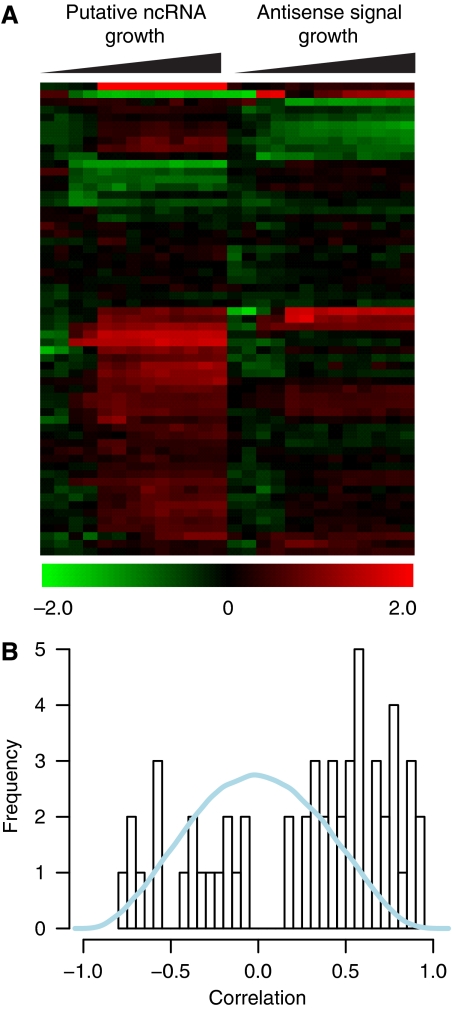
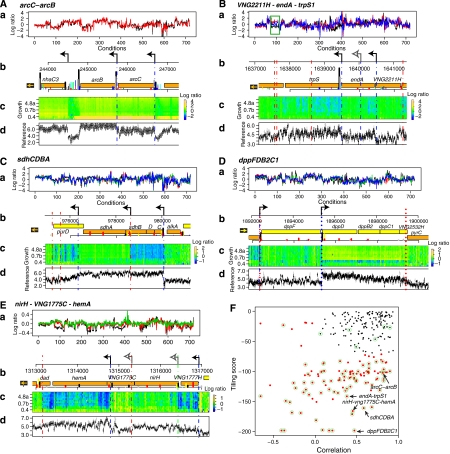
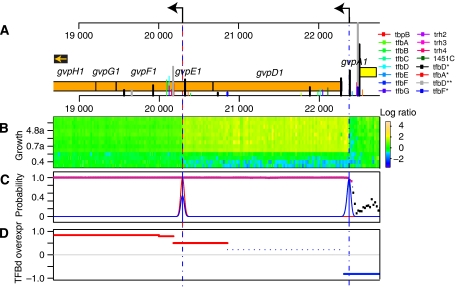
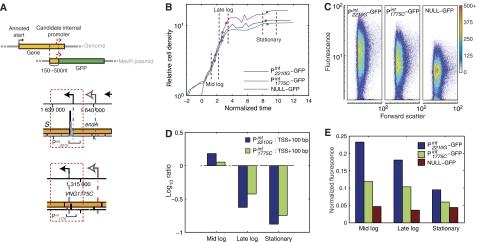
Despite the knowledge of complex prokaryotic-transcription mechanisms, generalized rules, such as the simplified organization of genes into operons with well-defined promoters and terminators, have had a significant role in systems analysis of regulatory logic in both bacteria and archaea. Here, we have investigated the prevalence of alternate regulatory mechanisms through genome-wide characterization of transcript structures of approximately 64% of all genes, including putative non-coding RNAs in Halobacterium salinarum NRC-1. Our integrative analysis of transcriptome dynamics and protein-DNA interaction data sets showed widespread environment-dependent modulation of operon architectures, transcription initiation and termination inside coding sequences, and extensive overlap in 3' ends of transcripts for many convergently transcribed genes. A significant fraction of these alternate transcriptional events correlate to binding locations of 11 transcription factors and regulators (TFs) inside operons and annotated genes-events usually considered spurious or non-functional. Using experimental validation, we illustrate the prevalence of overlapping genomic signals in archaeal transcription, casting doubt on the general perception of rigid boundaries between coding sequences and regulatory elements.


Conflict of interest statement

The authors declare that they have no conflict of interest.

Figures

Figure 1
Figure 1
Transcriptome structure and growth-phase-dependent changes in Halobacterium salinarum NRC-1. (A) Genome map of a segment of the main chromosome of H. salinarum NRC-1 (NC_002607) with corresponding signal intensity of total RNA from a mid-log phase culture (‘reference RNA') hybridized to 60mer overlapping probes in a high-density tiling array. Genes in the forward and reverse strands are shown in yellow and orange, respectively. Each blue dot represents probe intensity (in log2 scale) at the given genomic location in the forward (upper panel) or reverse (lower panel) strands. The overlaid red line is the result of a segmentation algorithm that was applied to determine transcription start sites (TSS and black arrows), transcription termination sites (TTS), untranslated regions in mRNAs (3′ UTR), and putative non-coding RNAs. (B) Dynamic changes in transcriptome structure were evaluated (Figure 2) at different phases of growth in a standard laboratory batch culture. Important physiological changes that are reflected in differential expression of corresponding mRNAs during the various phases of growth are indicated with a heat map (Facciotti et al, submitted).
Figure 2
Figure 2
A multitiered approach to characterize transcriptome structure. The transcriptome structure was determined through integration of RNA-hybridization signal (Figure 1), and analysis of relative changes in RNA levels corresponding to each probe. In each panel, the horizontal axis indicates genomic coordinates on the main chromosome and the two sub-panels show strand-specific signals (denoted by a yellow arrow for the forward and an orange arrow for the reverse strand). (A) Putative protein-coding genes on the forward and reverse strands are shown as yellow and orange rectangles, respectively, along with protein–DNA interaction sites (vertical bars, color coded per TF) determined by MeDiChI analysis of ChIP–chip data. Height of each vertical bar represents putative strength of binding event (proportional to chip signal intensity). Binding sites derived from high-resolution tiling array data are indicated by an asterisk (*) in the inset legend. (B) Mean reference-RNA hybridization signal (black dots) and associated error for each probe from 54 replicate experiments was normalized for sequence-content bias; the non-normalized data are shown with gray points (vertical axis: log2(signal intensity)). (C) Dynamic changes in the transcriptome are illustrated as a heat map along the genome (X-axis), with time along the growth curve increasing vertically from bottom (early log phase) to top (stationary phase); the color scale represents log2 ratio of transcript-level changes during growth relative to the reference RNA (blue is downregulated; yellow upregulated). (D) Correlation of growth-related transcriptional-change measurements for each probe with that of its neighboring (downstream) probe shown along the genome, exponentiated in this plot to enhance the visual contrast between correlated and uncorrelated probes. Probes with high correlation (r>0.9) are highlighted in red. (E) The probability of assigning each probe to a transcribed region was calculated by integrating data from panels A to D; probes with high probability (P>0.9) are highlighted in pink (Materials and methods). An integrated multivariate segmentation approach was used to identify and classify transcript boundaries as either TSSs (blue lines; dotted lines correspond to the forward strand and dashed lines to the reverse strand) or TTSs (red lines; dotted lines correspond to the forward strand, dashed lines to the reverse strand). Blue and red bootstrap density distributions indicate the relative likelihood of associating each position with a transcript boundary. This multivariate approach significantly improves the detection of transcript boundaries, in particular for TTSs. For example, the TTS for carB is difficult to determine from hybridization signals for reference RNA (B), but its differential expression during growth enables the identification of its TTS. The gradual decay in signal at the 3′ end of carA results in the assignment of multiple TTS.
Figure 3
Figure 3
New non-coding RNAs in Halobacterium salinarum NRC-1. (A) Expression profiles of 61 putative ncRNAs and their respective antisense transcripts during growth. (B) The bimodal distribution of correlations between putative ncRNAs profiles and antisense transcripts suggests the ncRNAs might stabilize or destabilize transcripts on the opposite strand (the null distribution from randomly selected probes is shown in blue).
Figure 4
Figure 4
Conditional modulation of operon organization. Analysis of predicted operon structures identifies unexpected internal promoters that conditionally break the organization during cellular responses in differing environments. (A) The high degree of co-expression of arcC (red) and arcB (black) transcript-level changes in diverse environments (probed by ∼700 microarray experiments) (a) coupled to their genomic organization (b) strongly suggested co-transcription of these genes as an operon. Dynamic transcriptional changes of these genes during growth (c) also support this prediction. However, the integrated transcriptome-structure analysis identified a promoter (black arrow along genome coordinates of plasmid pNRC200 (NC_002608) in (b) and vertical blue line spanning panels b–d) in the 56-nt intergenic region between arcB and arcC. The location of the promoter is consistent with the different absolute levels of transcripts spanning the two genes (d) as well as with locations of TFBSs (vertical lines in the pNRC200 map in (b); for color code see Figure 2). (B) Although the predicted operon organization of VNG2211H (blue), endA (red), and trpS1 (black) is supported by their co-expression in most environments, their expression is not correlated during a few responses, including experiments investigating H. salinarum NRC-1 interaction with a unicellular alga (green box) (a). This differential regulation was also observed during growth (c) and could be explained by an alternate promoter within the coding sequence of endA (black arrow) whose location was corroborated by co-localized TFBSs (b) and a distinct TSS (c and d). A second weak TSS was also identified internal to endA (gray open arrow). (C) Genes in the predicted operon sdhCDBA (sdhC - blue, sdhD - green, sdhB – red, and sdhA - black) are co-expressed in most of the environmental perturbations, except for sdhA during a few responses. (b) TFBS (vertical lines, color coded as Figure 2) are found near the TSS for sdhC and in the coding region of sdhB (black arrows, blue dashed lines). (c) Dynamic changes during growth show that sdhCDB is downregulated and sdhA does not have the expression levels altered (d) and reference-RNA hybridization shows that sdhA is expressed. (D) Operon dppFDB2C1. (a) dppF (black) and dppD (red), dppB2 (green) and dppC1 (blue) are organized in a predicted operon and are co-expressed in most of the environmental perturbations. TSS identified for dppF and dppDB2C2 (black arrows and blue dotted lines) are localized near (b) TFBS (vertical lines, color coded according to Figure 2), which could explain the (c) differential expression of dppF and dppDB2C1 during growth. (E) Operon nirH-VNG1775C-hemA. (a) nirH (green), VNG1775C (red), and hemA (black) are organized in a predicted operon and co-expressed in most of the environmental perturbations. (b) TFBS localized internal to VNG1775C (vertical lines) are found near the TSS for hemA (black arrow), which could explain (c) the differential expression of this gene at higher cell densities. (F) Conditional operons were identified in a genome-wide manner by analyzing two parameters: minimum correlation score along all 719 environmental conditions between each gene in each predicted operon (horizontal axis) and minimum ‘tiling score', which quantifies the difference in the tiling probe levels for genes constituting the operon (vertical axis; see Results and Discussion for details). Green circles represent operons that were manually identified as condition dependent and were used as a training set for the conditional-operon classification. Red dots represent operons that were automatically classified as condition dependent (see Materials and methods for details). The conditional operons described above are highlighted.
Figure 5
Figure 5
TF binding internal to coding regions results in transcriptome-structure changes. A putative promoter and a terminator internal to the coding sequence of gvpE1, a gas-vesicle biogenesis regulator, is corroborated by co-localized TFBSs for several TFs, including TFBd (A). Although the activity of the terminator was verified by growth-phase-dependent termination of transcription originating upstream to gvpD1 (B), this region also presented high probability of being transcribed (P>0.9 are highlighted in pink) and a putative transcription start site from an internal promoter (blue line) (C); the internal promoter could be validated by analyzing the transcriptome structure in a strain overexpressing TFBd (D). The red line indicates a break in the transcription levels of the strain overexpressing TFBd relative to the reference RNA. This evidence associated with mapped TFBd-binding site and TSS suggests the presence of an internal promoter.
Figure 6
Figure 6
GFP expression validates promoters localized in the coding regions. (A) Internal promoter–GFP fusion construction strategy. The 150–500 nt regions upstream of internal transcription start sites (within tiling probe error) were fused to a GFP coding sequence on a mevinolin resistance (MevR) selectable expression plasmid. Selected internal promoters located within coding sequences of VNG2210G and VNG1775C used for GFP-expression validation are shown. (B) Sampling points along transformants growth curves. Batch cultures of strains carrying these internal promoter–GFP transcriptional fusions were sampled at mid-log, late-log, and stationary phase. For purpose of comparison, the growth curves were normalized in time relative to the characteristic growth rate observed during exponential growth. (C) The 2D densitometric scattergram of fluorescence versus forward scatter for cells with active internal promoters. Population density increases from blue to red. (D) Growth-phase-dependent transcriptional activity of the internal promoters was measured as the mean signal intensity for probes covering a region of 100 nt downstream of the internal TSS. (E) GFP production was used as proxy to validate that the growth-phase-dependent change in transcription observed in panel D was due to regulated transcription initiation by the internal promoters. The plots indicate normalized mean population fluorescence values during various growth phases (calculated from distributions shown in panel C for samples noted in panel B).

References

    1. Adhya S (2003) Suboperonic regulatory signals. Sci STKE 2003: pe22. - PubMed
    1. Baliga NS, Bjork SJ, Bonneau R, Pan M, Iloanusi C, Kottemann MC, Hood L, DiRuggiero J (2004) Systems level insights into the stress response to UV radiation in the halophilic archaeon Halobacterium NRC-1. Genome Res 14: 1025–1035 - PMC - PubMed
    1. Baliga NS, DasSarma S (1999) Saturation mutagenesis of the TATA box and upstream activator sequence in the haloarchaeal bop gene promoter. J Bacteriol 181: 2513–2518 - PMC - PubMed
    1. Baliga NS, Goo YA, Ng WV, Hood L, Daniels CJ, DasSarma S (2000) Is gene expression in Halobacterium NRC-1 regulated by multiple TBP and TFB transcription factors? Mol Microbiol 36: 1184–1185 - PubMed
    1. Bell SD, Kosa PL, Sigler PB, Jackson SP (1999) Orientation of the transcription preinitiation complex in archaea. Proc Natl Acad Sci USA 96: 13662–13667 - PMC - PubMed

Publication types