Parvovirus induced alterations in nuclear architecture and dynamics
- PMID: 19536327
- PMCID: PMC2694274
- DOI: 10.1371/journal.pone.0005948
Parvovirus induced alterations in nuclear architecture and dynamics
Abstract
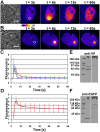
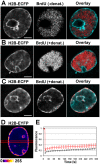
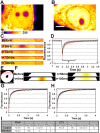
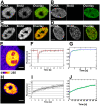
The nucleus of interphase eukaryotic cell is a highly compartmentalized structure containing the three-dimensional network of chromatin and numerous proteinaceous subcompartments. DNA viruses induce profound changes in the intranuclear structures of their host cells. We are applying a combination of confocal imaging including photobleaching microscopy and computational methods to analyze the modifications of nuclear architecture and dynamics in parvovirus infected cells. Upon canine parvovirus infection, expansion of the viral replication compartment is accompanied by chromatin marginalization to the vicinity of the nuclear membrane. Dextran microinjection and fluorescence recovery after photobleaching (FRAP) studies revealed the homogeneity of this compartment. Markedly, in spite of increase in viral DNA content of the nucleus, a significant increase in the protein mobility was observed in infected compared to non-infected cells. Moreover, analysis of the dynamics of photoactivable capsid protein demonstrated rapid intranuclear dynamics of viral capsids. Finally, quantitative FRAP and cellular modelling were used to determine the duration of viral genome replication. Altogether, our findings indicate that parvoviruses modify the nuclear structure and dynamics extensively. Intranuclear crowding of viral components leads to enlargement of the interchromosomal domain and to chromatin marginalization via depletion attraction. In conclusion, parvoviruses provide a useful model system for understanding the mechanisms of virus-induced intranuclear modifications.
Conflict of interest statement
Figures


Similar articles
-
Cytoplasmic Parvovirus Capsids Recruit Importin Beta for Nuclear Delivery.J Virol. 2020 Jan 31;94(4):e01532-19. doi: 10.1128/JVI.01532-19. Print 2020 Jan 31. J Virol. 2020. PMID: 31748386 Free PMC article.
-
Dynamics and interactions of parvoviral NS1 protein in the nucleus.Cell Microbiol. 2007 Aug;9(8):1946-59. doi: 10.1111/j.1462-5822.2007.00926.x. Epub 2007 Apr 5. Cell Microbiol. 2007. PMID: 17419720
-
Concepts to Reveal Parvovirus-Nucleus Interactions.Viruses. 2021 Jul 5;13(7):1306. doi: 10.3390/v13071306. Viruses. 2021. PMID: 34372512 Free PMC article. Review.
-
Promoter-Targeted Histone Acetylation of Chromatinized Parvoviral Genome Is Essential for the Progress of Infection.J Virol. 2016 Mar 28;90(8):4059-4066. doi: 10.1128/JVI.03160-15. Print 2016 Apr. J Virol. 2016. PMID: 26842481 Free PMC article.
-
The Structures and Functions of Parvovirus Capsids and Missing Pieces: the Viral DNA and Its Packaging, Asymmetrical Features, Nonprotein Components, and Receptor or Antibody Binding and Interactions.J Virol. 2023 Jul 27;97(7):e0016123. doi: 10.1128/jvi.00161-23. Epub 2023 Jun 27. J Virol. 2023. PMID: 37367301 Free PMC article. Review.
Cited by
-
Recruitment of DNA replication and damage response proteins to viral replication centers during infection with NS2 mutants of Minute Virus of Mice (MVM).Virology. 2011 Feb 20;410(2):375-84. doi: 10.1016/j.virol.2010.12.009. Epub 2010 Dec 30. Virology. 2011. PMID: 21193212 Free PMC article.
-
How Epstein-Barr Virus Induces the Reorganization of Cellular Chromatin.mBio. 2023 Feb 28;14(1):e0268622. doi: 10.1128/mbio.02686-22. Epub 2023 Jan 10. mBio. 2023. PMID: 36625581 Free PMC article.
-
Cytoplasmic Parvovirus Capsids Recruit Importin Beta for Nuclear Delivery.J Virol. 2020 Jan 31;94(4):e01532-19. doi: 10.1128/JVI.01532-19. Print 2020 Jan 31. J Virol. 2020. PMID: 31748386 Free PMC article.
-
Quantitative Microscopy Reveals Stepwise Alteration of Chromatin Structure during Herpesvirus Infection.Viruses. 2019 Oct 11;11(10):935. doi: 10.3390/v11100935. Viruses. 2019. PMID: 31614678 Free PMC article.
-
Reorganization of Nuclear Pore Complexes and the Lamina in Late-Stage Parvovirus Infection.J Virol. 2015 Nov;89(22):11706-10. doi: 10.1128/JVI.01608-15. Epub 2015 Aug 26. J Virol. 2015. PMID: 26311881 Free PMC article.
References
-
- Berk AJ. Recent lessons in gene expression, cell cycle control, and cell biology from adenovirus. Oncogene. 2005;24(52):7673–7685. - PubMed
-
- Everett RD. DNA viruses and viral proteins that interact with PML nuclear bodies. Oncogene. 2001;20(49):7266–7273. - PubMed
-
- Weitzman MD, Carson CT, Schwartz RA, Lilley CE. Interactions of viruses with the cellular DNA repair machinery. DNA Repair (Amst) 2004;3(8–9):1165–1173. - PubMed
MeSH terms
Substances
LinkOut - more resources
Full Text Sources
Miscellaneous

