Meta-Analysis
. 2009 Jun 17;4(6):e5950.
doi: 10.1371/journal.pone.0005950.

Clinical prognostic value of RNA viral load and CD4 cell counts during untreated HIV-1 infection--a quantitative review

Affiliations
Meta-Analysis

Clinical prognostic value of RNA viral load and CD4 cell counts during untreated HIV-1 infection--a quantitative review

Eline L Korenromp et al. PLoS One. .

Abstract

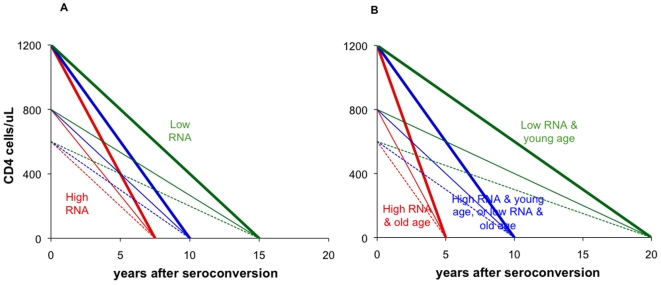
Background: The prognostic value of CD4 counts and RNA viral load for identifying treatment need in HIV-infected individuals depends on (a) variation within and among individuals, and (b) relative risks of clinical progression per unit CD4 or RNA difference.

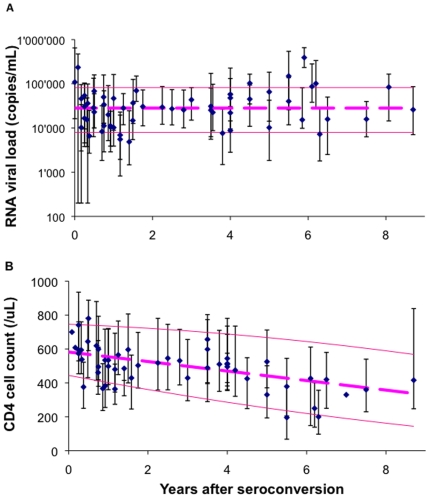
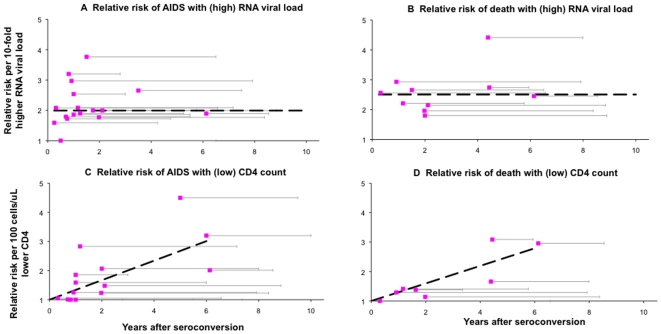
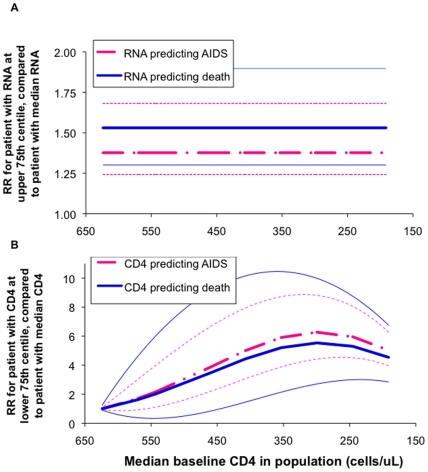
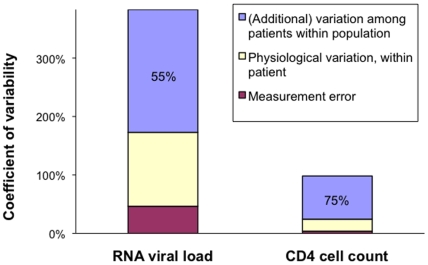
Methodology/principal findings: We reviewed these measurements across (a) 30 studies, and (b) 16 cohorts of untreated seropositive adults. Median within-population interquartile ranges were 74,000 copies/mL for RNA with no significant change during the course of infection; and 330 cells/microL for CD4, with a slight proportional increase over infection. Applying measurement and physiological fluctuations observed on chronically infected patients, we estimate that 45% of population-level variation in RNA, and 25% of variation in CD4, were due to within-patient fluctuations. Comparing a patient with RNA at upper 75(th) centile with a patient at median RNA, 5-year relative risks were 1.4 (95% CI 1.2-1.7) for AIDS and 1.5 (1.3-1.9) for death, without change over the course of infection. In contrast, for a patient with CD4 count at the lower 75(th) centile, relative risks increased from 1.0 at seroconversion to maxima of 6.3 (4.4-8.9) for AIDS and 5.5 (2.7-10.1) for death by year 6, when the population median had fallen to 300 cells/microL. Below 300 cells/microL, prognostic power did not increase, due to a narrower CD4 range.

Conclusions: Findings support the current WHO recommendation (used with clinical criteria) to start antiretroviral treatment in low-income settings at CD4 thresholds of 200-350 cells/microL, without pre-treatment RNA monitoring--while not precluding earlier treatment based on clinical, socio-demographic or public health criteria.


Conflict of interest statement

Competing Interests: The authors have declared that no competing interests exist.

Figures

Figure 1
Figure 1
(A) RNA viral load; (B) CD4 cell counts, over the course of untreated HIV-1 infection in adults. Each blue dot represents one datapoint of a median RNA or CD4, with the horizontal error bar indicating the corresponding interquartile range in the study population. Bold pink lines are medians across all population medians, for which thin pink lines indicate the corresponding interquartile range. Data sources: (a) –, , , , , –; (b) , , , , , , –, –. The (linear) trends over time since seroconversion in population median RNA and CD4 should not be interpreted as a proxy of trends in RNA and CD4 in individual patients. Since population medians are conditional on patients being alive, in individual patients RNA will instead tend to increase over time, and CD4 will tend to decrease stronger than apparent from Figure 1b.
Figure 2
Figure 2. Relative risks of clinical HIV progression per unit difference in RNA or CD4.
A. Risk of AIDS per 10-fold (1 log10/mL) higher RNA; B. Risk of death per 10-fold (1 log10/mL) higher RNA; C. Risk of AIDS per 100 cells/µL lower CD4; D. Risk of death per 100 cells/µL lower CD4. Each symbol represents the estimate from 1 study, of a population of HIV-1 infected adults (see Table 1 for details of studies). Risks are displayed as a function of the median time since HIV seroconversion that RNA or CD4 was first measured. Horizontal error bars indicate the median duration of follow-up over which RR was evaluated. Dashed lines in (a) and (b) indicate pooled median RRs across studies, which did not vary with time since seroconversion. Dashed lines in (c) and (d) indicate linear trends of increasing RR with stage that CD4 was measured (from a defined value of 1.0 at seroconversion; c: Pearson's R2 = 0.74; p<0.0001; d: Pearson's R2 = 0.89; p<0.0001). Median follow-up across studies and datapoints were (a) 4.8 years; (b) 6.3 years; (c) 4.9 years, (d) 4.6 years. If instead of univariate relative risks, multivariate relative risks were preferentially included from studies that reported both, results did essentially not change (a: 6 studies reporting both RRs, with median ratio of multivariate-to-univariate RR 0.82; b: 6 studies reporting both, median ratio of multivariate-to-univariate RR 0.84; c: 4 studies reporting both, median ratio of multivariate-to-univariate RR 0.94; d: 5 studies reporting both, median ratio of multivariate-to-univariate RR 0.91).
Figure 3
Figure 3. Population-level prognostic power of RNA and CD4 in untreated HIV-1 infection.
A. Relative prognostic risk (RR) for a typical patient at 75th centile highest RNA, compared compared to the average patient with exactly the population-median RNA value; B. Relative prognostic risk for a typical patient at 75th centile lowest CD4, compared compared to the average patient with exactly the population-median CD4 value. Results are expressed as a function of median CD4 in the population, for the range of median CD4 levels found in studies analyzed in Table 1 and Figure 1. CD4 population medians were calculated as a linear function of the median year after seroconversion, based on the studies presented in Table 1. Bold lines indicate best estimates; thin lines 95% confidence intervals.
Figure 4
Figure 4. Within-population variability in RNA and CD4 during untreated adult HIV-1 infection, by component of variation.
‘Coefficients of variability’ were defined and calculated as described in Table 2. The percentages written in the blue bars indicate the proportion of overall variability that is not attributable to within-patient factors.
Figure 5
Figure 5. Schematic natural history model of HIV-1 replication driving rates of CD4 decline and clinical progression.
A. Survival varies among individuals according to the level of viral replication – which is indicated by RNA after reach of the setpoint in the first months after seroconversion: patients with highest RNA (red lines) have shortest survival; patients with lowest RNA (green lines) have longest survival. Rates of CD4 decline varies according to (1) RNA setpoint; and (2) pre-infection CD4, which varies independently without influencing prognosis upon infection. Individuals with high CD4 before infection have faster subsequent CD4 decline (bold lines) than individuals with low pre-infection CD4 (dashed lines) – for a given RNA and duration of survival. This natural history model has earlier been proposed based on data of cohorts of homosexual men in New York city and Washington DC . B. Refinement of natural history model to incorporate prognostic determinants not (or not entirely) operating through RNA and CD4; these increase the within-population variability in survival (x-axis range). ‘Age’ here could symbolically be taken to also stand for other factors independently associated with prognosis: e.g. good immune constitution at baseline or low exposure to pathogens causing opportunistic infections, instead of young age.

References

    1. USA department of Health and Human Services Panel on antiretroviral guidelines for adults and adolescents–a working group of the Office of AIDS Research Advisory Council. Guidelines for the use of antiretroviral agents in HIV-1-Infected adults and adolescents. 29 January, 2008. http://aidsinfo.nih.gov/contentfiles/AdultandAdolescentGL.pdf.
    1. Hammer SM, Saag MS, Schechter M, et al. Treatment for adult HIV infection: 2006 recommendations of the International AIDS Society–USA panel. Top HIV Med. 2006;14:827–43. - PubMed
    1. Gilks CF, Crowley S, Ekpini R, et al. The WHO public-health approach to antiretroviral treatment against HIV in resource-limited settings. Lancet. 2006;368:505–10. - PubMed
    1. de Wolf F, Spijkerman I, Schellekens PT, et al. AIDS prognosis based on HIV-1 RNA, CD4+ T-cell count and function: markers with reciprocal predictive value over time after seroconversion. Aids. 1997;11:1799–806. - PubMed
    1. Henrard DR, Phillips JF, Muenz LR, et al. Natural history of HIV-1 cell-free viremia. Jama. 1995;274:554–8. - PubMed

Publication types

Substances