. 2009 Jun 19;30(6):832-44.
doi: 10.1016/j.immuni.2009.04.014.

The mTOR kinase differentially regulates effector and regulatory T cell lineage commitment

Affiliations

The mTOR kinase differentially regulates effector and regulatory T cell lineage commitment

Greg M Delgoffe et al. Immunity. .

Abstract

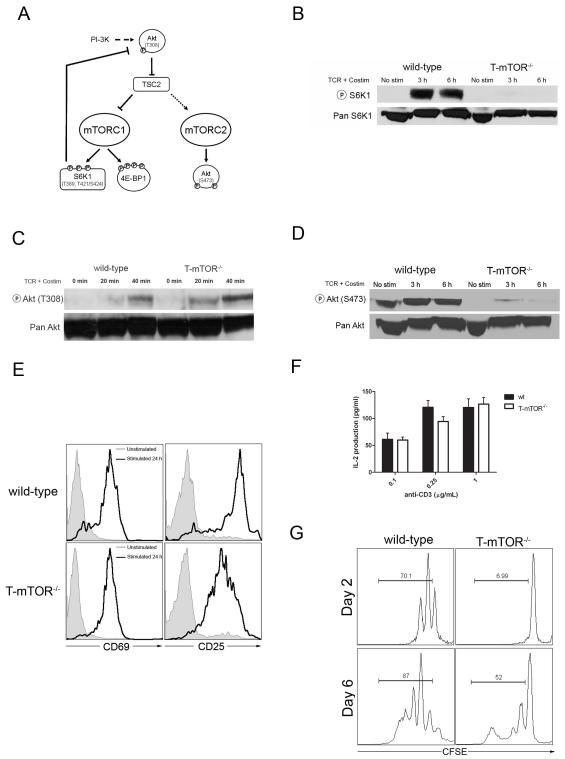
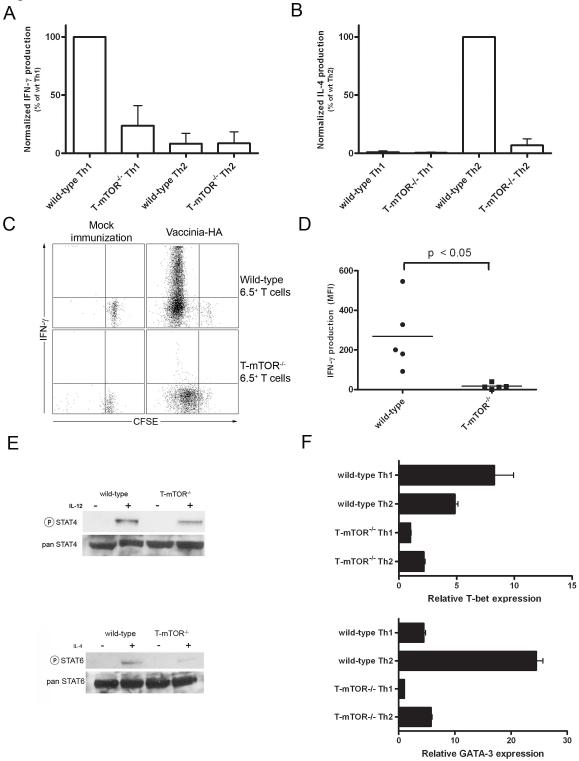
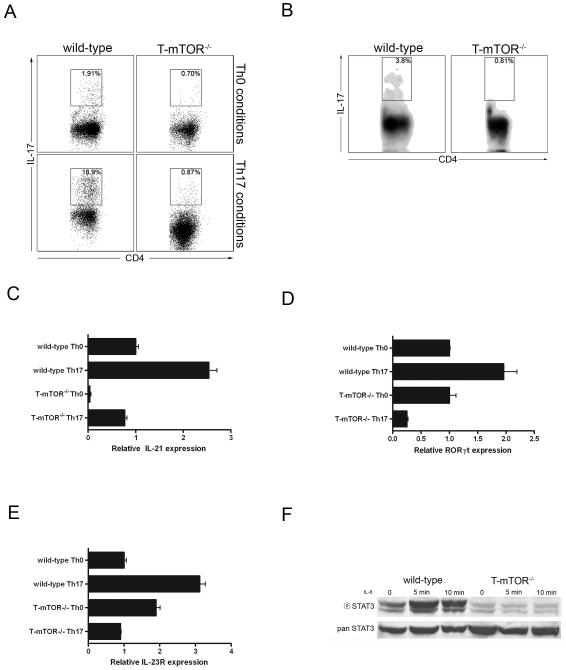
Effector T cell differentiation requires the simultaneous integration of multiple, and sometimes opposing, cytokine signals. We demonstrated mTOR's role in dictating the outcome of T cell fate. mTOR-deficient T cells displayed normal activation and IL-2 production upon initial stimulation. However, such cells failed to differentiate into T helper 1 (Th1), Th2, or Th17 effector cells. The inability to differentiate was associated with decreased STAT transcription factor activation and failure to upregulate lineage-specific transcription factors. Under normally activating conditions, T cells lacking mTOR differentiated into Foxp3(+) regulatory T cells. This was associated with hyperactive Smad3 activation in the absence of exogenous TGF-beta. Surprisingly, T cells selectively deficient in TORC1 do not divert to a regulatory T cell pathway, implicating both TORC1 and TORC2 in preventing the generation of regulatory T cells. Overall, our studies suggest that mTOR kinase signaling regulates decisions between effector and regulatory T cell lineage commitment.


Figures

Figure 1
Figure 1
Phenotypic analysis of conditional mTOR knockout mice. (A) PCR excision assay of cells from wt or T-mTOR-/- mice. “In” refers to amplification of primers confirming the presence of the gene. “Out” refers to amplification of primers confirming excision of the gene. (B) Immunoblot (IB) of mTOR in sorted populations. Raptor is included as a loading control. (C) FACS analysis of thymocytes harvested from mice. Foxp3 vs. CD25 is gated on CD4+ cells. (D) FACS analysis of splenocytes. Foxp3 vs. CD25 is gated on CD4+ cells. All data are representative of at least three independent experiments.
Figure 2
Figure 2
Characterization of T cell function in mTOR deficient T cells. (A) mTOR signaling proceeds through two complexes. (B) IB of phospho-S6K1 from CD4+ T cells stimulated with immobilized anti-CD3 (1μg/mL) and anti-CD28 (2μg/mL) for the indicated times. (C) IB of phospho-Akt (T308), as in B. (D) IB of phospho-Akt (S473), as in B. (E) Activation markers upon stimulation. Cells were gated on CD4 after 24 hours of mock or anti-CD3 stimulation. (F) IL-2 production from initial stimulation of mTOR deficient T cells. Data are pooled from three independent experiments. Error bars indicate S.D. (G) Proliferation analysis of mTOR deficient T cells by CFSE dilution. Plots are gated on CD4+ T cells. Gates indicate cells that have undergone at least one division. All data are representative of at least three independent experiments.
Figure 3
Figure 3
mTOR deficient T cells fail to differentiate into Th1 or Th2 effector cells. (A) IFN-γ production was measured by ELISA. Total lymphocytes were isolated from mice and stimulated with anti-CD3 in vitro and rested 5 d in the presence of Th1 or Th2 skewing conditions. T cells were isolated by magnetic separation and then restimulated with anti-CD3 and anti-CD28 for 24 h. Data are pooled from three independent experiments and are represented as percent IFN-γ activity relative to wt Th1. (B) As in A, but for IL-4 (percentages are relative to wt Th2). (C) Proliferation and IFN-γ production of donor cells was measured by intracellular cytokine staining 5 days post adoptive transfer. Production = mean fluorescence multiplied by the percent CFSElo. (D) IFN-γ production compiled from multiple mice as in C. Data are representative of three independent experiments. (E) Previously activated T cells were stimulated with IL-12 (5 ng/mL) or IL-4 (5 ng/mL) for 30 mins and blotted for phospho-STAT4 or STAT6, respectively. (F) T-bet and GATA-3 expression from skewed Th1 or Th2 cells by real-time PCR. Values are normalized to 18s rRNA levels and scaled to T-mTOR-/- Th1 conditions. Error bars indicate S.D. Data are representative of five independent experiments.
Figure 4
Figure 4
mTOR deficient T cells fail to differentiate to Th17 effector cells. (A) FACS analysis of Th17 skewed T cells. T cells were activated in the presence or absence of Th17 skewing conditions and restimulated in vitro. (B) Th17 FACS analysis of Peyer’s patch (PP) lymphocytes. PPs were isolated from wt or T-mTOR-/- mice and stimulated with PMA/ionomycin for 5 h. (C) IL-21 expression in nonbiasing or Th17 skewing conditions by real-time PCR analysis. Data are normalized to 18s rRNA and scaled to wt nonbiasing conditions. Error bars indicate SD. (D) As in C, but for the Th17-associated transcription factor ROR-γt. (E) As in C, but for IL-23R. (F) Previously activated T cells were stimulated with IL-6 (5ng/mL) for 5 or 10 mins and blotted for phospho-STAT3. All data are representative of at least three independent experiments.
Figure 5
Figure 5
mTOR deficient T cells differentiate down a regulatory pathway. (A) FACS analysis of CD4+ T cells from wt or T-mTOR-/- mice pre-stimulation and 5 d post-stimulation. Inlaid panel shows GITR expression measured by FACS. The CD25+Foxp3+ fraction appears as a solid line, the Foxp3- fraction is shaded grey. (B) In vitro suppression assay with CD25+ fraction of mTOR deficient T cells. Proliferation of responder cells was measured by CFSE dilution 72 h post stimulation. (C) As in A, but some cultures were supplemented with IL-2. (D) T cells were isolated from wt or T-mTOR-/- mice, CFSE labeled, and stimulated with anti-CD3 (107 per timepoint). Cultures were then supplemented with IL-2 and IL-7. On day 2, 4, 6, and 8 post stimulation cells were removed from culture, counted, and restimulated with anti-CD3 (5μg/mL) and anti-CD28 (2μg/mL), then interrogated by FACS for IFN-γ production and Foxp3 expression. Plots are representative of day 6 cultures from this experiment. IFN-γ+ gates were drawn using unstimulated controls. (E) Treg upregulation occurs in vitro due to an increase in Foxp3+ cells rather than death of effector cells. Data from D were compiled from three experiments and absolute numbers were calculated. (F) Adoptive transfers were performed as in Figure 3C. Donor cells were interrogated by differential Thy1 expression (FACS). (G) Wt B10.D2 host mice (Thy1.2+) were infected with Vac-HA and after 24 h wt or T-mTOR-/- 6.5+ T cells (Thy1.1/Thy1.2) were adoptively transferred. One day later, mice received a second transfer of 6.5+ CFSE-labeled naïve wt responder T cells (Thy1.1+). Splenocytes were harvested and stimulated with peptide and tested for cytokine production. Plots are gated on responders by Thy1.1 homozygosity. (H) IFN-γ production compiled from multiple mice as in E. Data are representative of three independent experiments. (I) Foxp3+ expression of the transferred wt and mTOR deficient (Thy1.1/Thy1.2) population from G.
Figure 6
Figure 6
TORC1 deficient T cells fail to become regulatory T cells (A) TGF-β production in splenocytes from wt and mTOR deficient T cell cultures as measured by ELISA. Data are pooled from 7 experiments. Error bars indicate S.D. (B) mTOR deficient cells have hyperphosphorylated Smad3. Previously activated cells were stimulated with TGF-β (5ng/mL) for 30 min and probed (IB) for phospho-Smad3. (C) TGF-β is necessary for mTOR-deficiency mediated Treg induction. Cells were stimulated as in 5A in the presence or absence of TGF-β neutralizing antibodies. (D) Rheb deficiency selectively inhibits TORC1 activity. Previously activated T-Rheb-/- T cells were stimulated in vitro with anti-CD3 and anti-CD28 for the indicated times and probed for mTOR substrates by IB. Pan Akt is included as a loading control. (E) Rheb-deficient T cells do not spontaneously convert into Tregs. wt, T-Rheb-/- and T-mTOR-/- cells were stimulated with anti-CD3 and rested in IL-7 supplemented media for 5 days and interrogated for Treg markers. (F) Rheb deficient T cells can be skewed to Tregs. wt and T-Rheb-/- cells were stimulated in the presence or absence of Treg skewing conditions and analyzed after 5 days. Cells were then interrogated for Treg markers by FACS. All data are representative of at least three independent experiments.

Comment in

References

    1. Abraham RT, Wiederrecht GJ. Immunopharmacology of rapamycin. Annu Rev Immunol. 1996;14:483–510. - PubMed
    1. Apostolou I, Sarukhan A, Klein L, von Boehmer H. Origin of regulatory T cells with known specificity for antigen. Nat Immunol. 2002;3:756–763. - PubMed
    1. Avruch J, Hara K, Lin Y, Liu M, Long X, Ortiz-Vega S, Yonezawa K. Insulin and amino-acid regulation of mTOR signaling and kinase activity through the Rheb GTPase. Oncogene. 2006;25:6361–6372. - PubMed
    1. Basu S, Golovina T, Mikheeva T, June CH, Riley JL. Cutting edge: Foxp3- mediated induction of pim 2 allows human T regulatory cells to preferentially expand in rapamycin. J Immunol. 2008;180:5794–5798. - PMC - PubMed
    1. Bettelli E, Korn T, Kuchroo VK. Th17: the third member of the effector T cell trilogy. Curr Opin Immunol. 2007 - PMC - PubMed

Publication types

MeSH terms