Post microtextures accelerate cell proliferation and osteogenesis
- PMID: 19539062
- PMCID: PMC3796579
- DOI: 10.1016/j.actbio.2009.06.016
Post microtextures accelerate cell proliferation and osteogenesis
Abstract
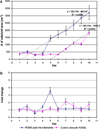
The influence of surface microtexture on osteogenesis was investigated in vitro by examining the proliferation and differentiation characteristics of a class of adult stem cells and their progeny, collectively known as connective tissue progenitor cells (CTPs). Human bone marrow-derived CTPs were cultured for up to 60 days on smooth polydimethylsiloxane (PDMS) surfaces and on PDMS with post microtextures that were 10 microm in diameter and 6 microm in height, with 10 microm separation. DNA quantification revealed that the numbers of CTPs initially attached to both substrates were similar. However, cells on microtextured PDMS transitioned from lag phase after 4 days of culture, in contrast to 6 days for cells on smooth surfaces. By day 9 cells on the smooth surfaces exhibited arbitrary flattened shapes and migrated without any preferred orientation. In contrast, cells on the microtextured PDMS grew along the array of posts in an orthogonal manner. By days 30 and 60 cells grew and covered all surfaces with extracellular matrix. Western blot analysis revealed that the expression of integrin alpha5 was greater on the microtextured PDMS compared with smooth surfaces. Real time reverse transcription-polymerase chain reaction revealed that gene expression of alkaline phosphatase had decreased by days 30 and 60, compared with that on day 9, for both substrates. Gene expression of collagen I and osteocalcin was consistently greater on post microtextures relative to smooth surfaces at all time points.
Figures


Similar articles
-
Response of bone marrow derived connective tissue progenitor cell morphology and proliferation on geometrically modulated microtextured substrates.Biomed Microdevices. 2013 Jun;15(3):385-96. doi: 10.1007/s10544-012-9727-7. Biomed Microdevices. 2013. PMID: 23378044 Free PMC article.
-
Growth of connective tissue progenitor cells on microtextured polydimethylsiloxane surfaces.J Biomed Mater Res. 2002 Dec 15;62(4):499-506. doi: 10.1002/jbm.10353. J Biomed Mater Res. 2002. PMID: 12221697
-
Modulating human connective tissue progenitor cell behavior on cellulose acetate scaffolds by surface microtextures.J Biomed Mater Res A. 2009 Sep 15;90(4):1198-205. doi: 10.1002/jbm.a.32160. J Biomed Mater Res A. 2009. PMID: 18680188 Free PMC article.
-
Analysis of connective tissue progenitor cell behavior on polydimethylsiloxane smooth and channel micro-textures.Biomed Microdevices. 2002 Dec;4(4):267-75. doi: 10.1023/a:1020950022074. Biomed Microdevices. 2002. PMID: 16596170 Free PMC article.
-
Tribological Effects of Surface Biomimetic Micro-Nano Textures on Metal Cutting Tools: A Review.Biomimetics (Basel). 2025 May 1;10(5):283. doi: 10.3390/biomimetics10050283. Biomimetics (Basel). 2025. PMID: 40422112 Free PMC article. Review.
Cited by
-
Potential of Carbon-Based Nanocomposites for Dental Tissue Engineering and Regeneration.Materials (Basel). 2021 Sep 6;14(17):5104. doi: 10.3390/ma14175104. Materials (Basel). 2021. PMID: 34501203 Free PMC article. Review.
-
Stem cell and biomaterials research in dental tissue engineering and regeneration.Dent Clin North Am. 2012 Jul;56(3):495-520. doi: 10.1016/j.cden.2012.05.009. Dent Clin North Am. 2012. PMID: 22835534 Free PMC article. Review.
-
Emerging links between surface nanotechnology and endocytosis: impact on nonviral gene delivery.Nano Today. 2010 Dec 1;5(6):553-569. doi: 10.1016/j.nantod.2010.10.007. Nano Today. 2010. PMID: 21383869 Free PMC article.
-
Response of bone marrow derived connective tissue progenitor cell morphology and proliferation on geometrically modulated microtextured substrates.Biomed Microdevices. 2013 Jun;15(3):385-96. doi: 10.1007/s10544-012-9727-7. Biomed Microdevices. 2013. PMID: 23378044 Free PMC article.
-
Tissue-informed engineering strategies for modeling human pulmonary diseases.Am J Physiol Lung Cell Mol Physiol. 2019 Feb 1;316(2):L303-L320. doi: 10.1152/ajplung.00353.2018. Epub 2018 Nov 21. Am J Physiol Lung Cell Mol Physiol. 2019. PMID: 30461289 Free PMC article. Review.
References
-
- El-Amin SF, Botchwey E, Tuli R, Kofron MD, Mesfin A, Sethuraman S, et al. Human osteoblast cells: isolation, characterization, and growth on polymers for musculoskeletal tissue engineering. J Biomed Mater Res. 2006;76A:439–449. - PubMed
-
- Curtis A. Nanofeaturing materials for specific cell responses. Mater Res Soc Symp Proc. 2005;845:175–184.
-
- Healy KE, Thomas CH, Rezania A, Kim JE, McKeown PJ, Lom B, et al. Kinetics of bone cell organization and mineralization on materials with patterned surface chemistry. Biomaterials. 1996;17:195–208. - PubMed
-
- Raghavan S, Chen CS. Micropatterned environments in cell biology. Adv Mater. 2004;16:1303–1313.
-
- Chen CS, Jiang X, Whitesides GM. Microengineering the environment of mammalian cells in culture. MRS Bull. 2005;30:194–201.
MeSH terms
Substances
Grants and funding
LinkOut - more resources
Full Text Sources
Other Literature Sources
Medical

