Review
. 2009 Sep 21;260(2):308-31.
doi: 10.1016/j.jtbi.2009.06.011. Epub 2009 Jun 17.

Modeling HIV persistence, the latent reservoir, and viral blips

Affiliations
Review

Modeling HIV persistence, the latent reservoir, and viral blips

Libin Rong et al. J Theor Biol. .

Abstract

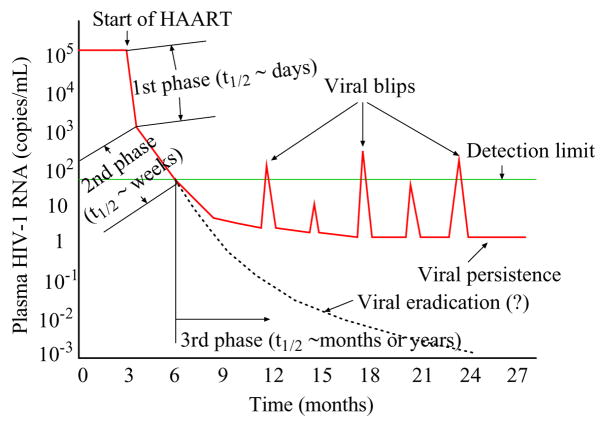
HIV-1 eradication from infected individuals has not been achieved with the prolonged use of highly active antiretroviral therapy (HAART). The cellular reservoir for HIV-1 in resting memory CD4(+) T cells remains a major obstacle to viral elimination. The reservoir does not decay significantly over long periods of time but is able to release replication-competent HIV-1 upon cell activation. Residual ongoing viral replication may likely occur in many patients because low levels of virus can be detected in plasma by sensitive assays and transient episodes of viremia, or HIV-1 blips, are often observed in patients even with successful viral suppression for many years. Here we review our current knowledge of the factors contributing to viral persistence, the latent reservoir, and blips, and mathematical models developed to explore them and their relationships. We show how mathematical modeling has helped improve our understanding of HIV-1 dynamics in patients on HAART and of the quantitative events underlying HIV-1 latency, reservoir stability, low-level viremic persistence, and emergence of intermittent viral blips. We also discuss treatment implications related to these studies.


Figures

Figure 1
Figure 1
The plasma viral load remains at a relatively constant level during chronic infection before initiation of HAART. Following treatment the plasma RNA level undergoes a multiphasic decay and declines to below 50 copies/mL after 3–6 months. However, virus cannot be eradicated with current antiretroviral therapy. A low level of viremia persists in patients with apparently suppressive treatment for many years. A number of patients experience intermittent viral blips, with transient HIV-1 RNA levels above the detection limit.
Figure 2
Figure 2
The steady state viral load vs drug efficacy for both the basic model (Eq. (7), solid line) and the model with density-dependent infected cell death (dashed line). The values of parameters are [14]: λ = 104 mL−1 day−1, k = 8 × 10⁻⁷ mL day−1, c = 13 day−1, δ = 0.7 day−1, N = 100, d = 0.01 day−1, ω = 0.1, pv = 70 day−1. δ′ is chosen to be 0.274 day−1(mL/cell)ω such that both models have the same initial viral load when ε = 0. The basic model is much more sensitive to changes in drug efficacy, particularly when ε is close to the critical drug threshold (~0.85). The green horizontal line represents the detection limit.
Figure 3
Figure 3
The steady state viral load vs drug efficacy for the two-compartment model (Eq. (10), dashed line) and its corresponding one-compartment model (solid line). The values of parameters are [14]: f = 0.45, ϕ = 0.195, μ = 0.07 day−1, NT = 100, NC = 4.11, D1 = 0.1048 day−1, D2 = 19.66 day−1. The other parameter values are the same as in Fig. 2. The two-compartment model is less sensitive to changes in drug efficacy than the one-compartment model. The green horizontal line represents the detection limit.
Figure 4
Figure 4
Simulations of Eq. (16) with amin = 0 and ε = 1. The net proliferation rate r varies: r = −0.00171 day−1 (blue solid line); r = 0 (red dashed line); r = 0.0008 day−1 (black dotted line). The other parameter values are [108]: ω = 9.39 × 10⁻³ day−1, η = 3 ×10⁻⁶, k = 2.4 ×10⁻⁸ mL day−1, T0 = 595 cells/μl, N = 2 × 10⁴, δ = 1 day−1, c = 23 day−1. (a) The pool size of latently infected cells increases as r > 0, decreases as r < 0, and stabilizes to a steady state as r = 0. (b) In each case, the viral load decreases to zero. Thus, low-level viremic persistence cannot be generated by Eq. (16) with amin = 0 and ε = 1.
Figure 5
Figure 5
Simulations of Eq. (16) with amin ≥ 0 and ε = 1. The value of r varies: r = amin = a0/2 (blue solid line); r = amin = a0/3 (red dashed line); r = amin = 0 (black dotted line), where a0 = 8.625 ×10⁻³ day−1 is the initial activation rate of latently infected cells. The other parameter values are the same as in Fig. 4. Both the viral and latent reservoir persistence can be obtained when r = amin > 0. The larger the value of r, the higher the levels of latently infected cells and viral load.
Figure 6
Figure 6
Simulation of the target cell activation model (Eq. (21)). The model can generate a transient viral load increase. The parameter values are [101]: λ1 = 104 mL−1 day−1, λ2 = 56 mL−1 day−1, k1 = 8 × 10⁻⁷ mL day−1, k2 = 10−4 mL day−1, ε = 0.9, dT = 0.01 day−1, f = 0.6, ϕ = 0.195, δ = 0.7 day−1, μ = 0.07 day−1, NT = 100, NC = 4.11, c = 23 day−1, a = 0.2 day−1, K4 = 1000 mL−1, r0 = 2 day−1, Amax = 108 mL−1, γ = 10−3 day−1, d0 = 0.01 day−1, p = 2.92 day−1, d = 0.1 day−1, dE = 0.325 day−1, p0 = 1 day−1, n = 1, K8 = 1000 mL−1. The green horizontal line represents the detection limit.
Figure 7
Figure 7
Simulations of Eq. (24) show that it is able to generate intermittent viral blips. (a) The interval between two consecutive activations, ΔT, obeys a normal distribution N (50, 10). The duration each activation lasts, Δt, obeys a uniform distribution U (4, 6). The probability pL obeys a uniform distribution U (0.3, 0.8). The decay rate of the latent reservoir is not significantly different from zero. (b) ΔT ~ N (40, 10), Δt ~ U (4, 6), pL ~ U (0.4, 0.65). The latent cell pool size decreases, but the decay rate is very small, representing a very long half-life, for example, 44 months. (c) ΔT ~ N (50, 10), Δt ~ U (7, 14), pL ~ U (0.3, 0.5). The latent reservoir shows a quicker decay than in the scenario (b), corresponding to a shorter half-life, such as 6 months. The other parameter values used in the simulations are [194]: λ = 104 mL−1 day−1, dT = 0.01 day−1, ε = 0.85, k = 2.4 × 10⁻⁸ mL day−1, η = 0.001, d0 = 0.001 day−1, aL = 0.1 day−1, δ′ = 0.7863 day−1(mL/cell)ω, ω = 0.44, pv = 2000 day−1, c = 23 day−1.
Figure 8
Figure 8
Simulations of Eq. (27) show that it can robustly generate viral blips. The decay of the latent reservoir is primarily determined by p, which represents the potential of resulting activated cells to proliferate during the latently infected cell response. (a) p = 1.4 day−1. No statistically significant decay of latently infected cells was observed. (b) p = 1.35 day−1. The latent reservoir decays very slowly. This realization shows a half-life of ~ 44 months. (c) p = 1 day−1. The latent reservoir decays more quickly than in (b), representing a half-life of about 6 months. The parameter values used are [195]: ΔT ~ N(50, 10), Δt ~ U(4, 6), a = 0.05 day−1, σ = 0.8 day−1, ρ = 0.01 day−1. The other parameter values are the same as in Fig. 7.

References

    1. Adams BM, Banks HT, Davidian M, Rosenberg ES. Estimation and prediction with HIV-treatment interruption data. Bull Math Biol. 2007;69:563–584. - PubMed
    1. Ahmed R, Gray D. Immunological memory and protective immunity: understanding their relation. Science. 1996;272:54–60. - PubMed
    1. Bailey JR, Sedaghat AR, Kieffer T, Brennan T, Lee PK, Wind-Rotolo M, Haggerty CM, Kamireddi AR, Liu Y, Lee J, Persaud D, Gallant JE, Cofrancesco J, Jr, Quinn TC, Wilke CO, Ray SC, Siliciano JD, Nettles RE, Siliciano RF. Residual human immunodeficiency virus type 1 viremia in some patients on antiretroviral therapy is dominated by a small number of invariant clones rarely found in circulating CD4+ T cells. J Virol. 2006;80:6441–6457. - PMC - PubMed
    1. Bajaria SH, Webb G, Kirschner DE. Predicting differential responses to structured treatment interruptions during HAART. Bull Math Biol. 2004;66:1093–1118. - PubMed
    1. Benson CA. Structured treatment interruptions–new findings. Top HIV Med. 2006;14:107–111. - PubMed

Publication types