

Event-related oscillations as risk markers in genetic mouse models of high alcohol preference
- PMID: 19540906
- PMCID: PMC2741167
- DOI: 10.1016/j.neuroscience.2009.06.039
Event-related oscillations as risk markers in genetic mouse models of high alcohol preference
Abstract
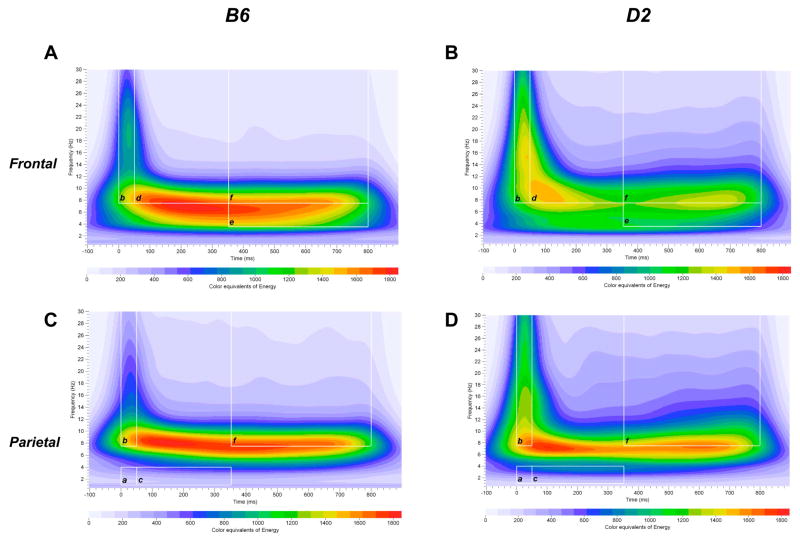
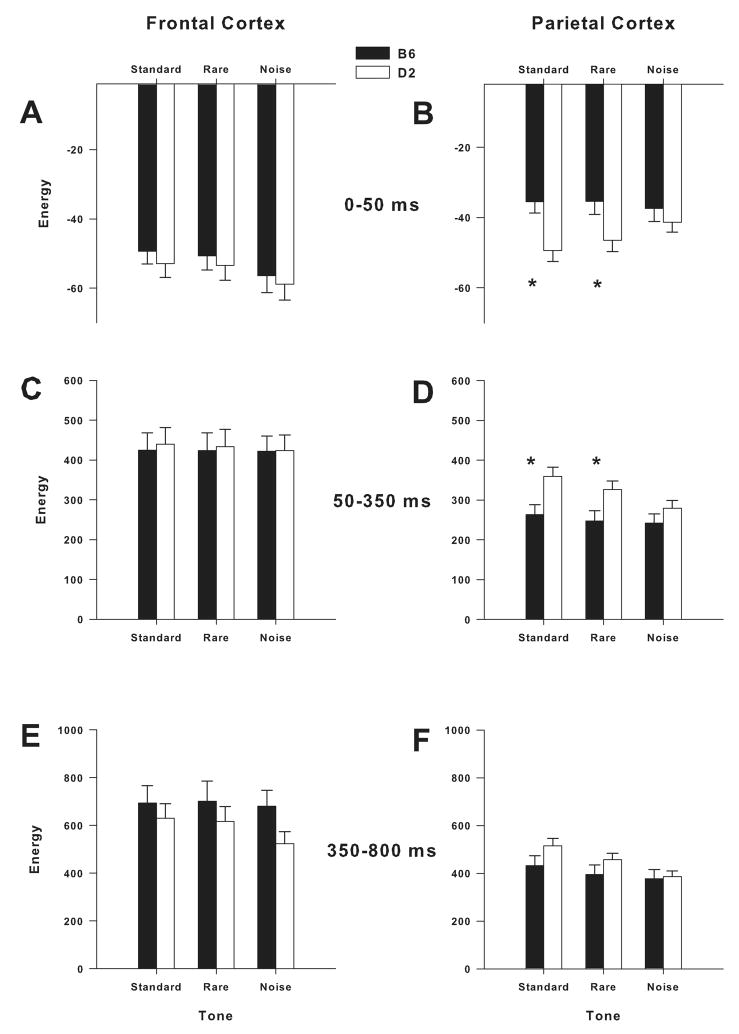
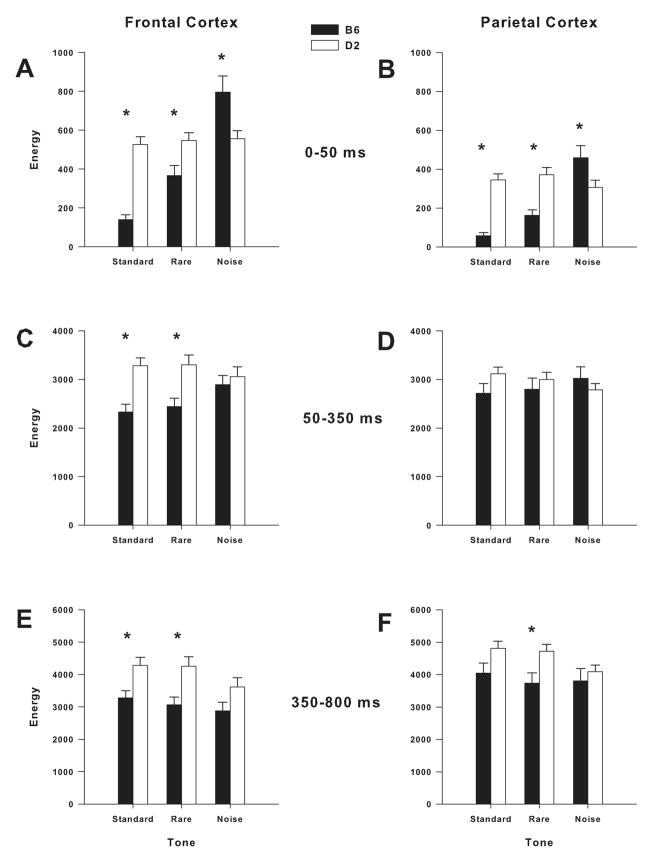
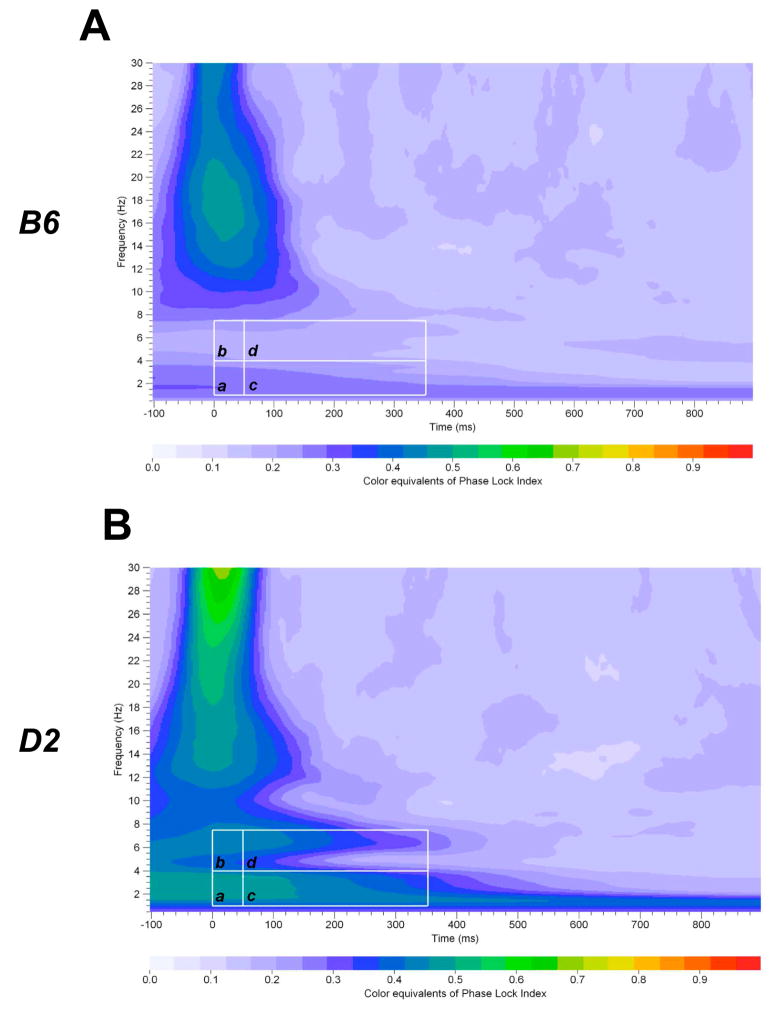
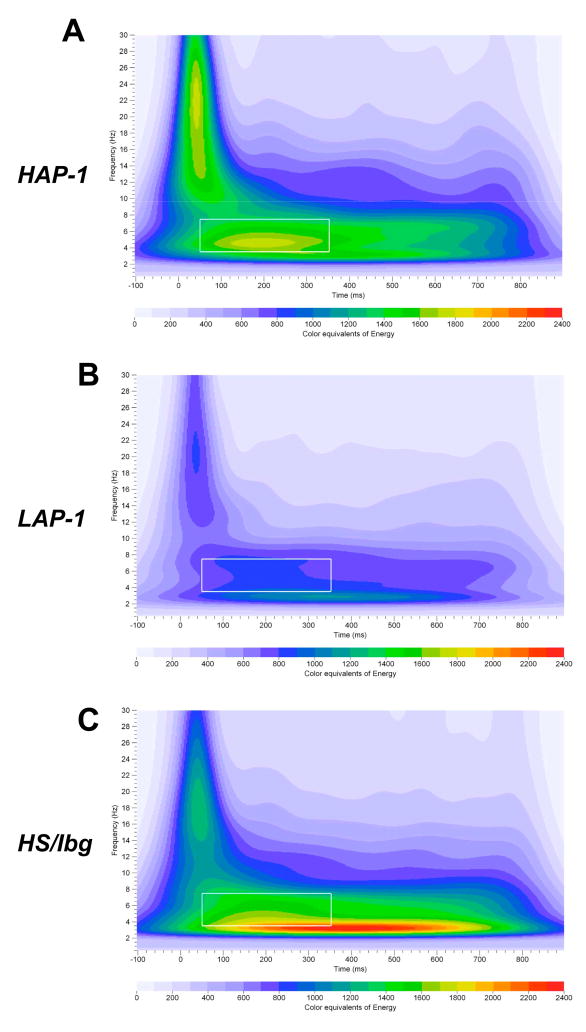
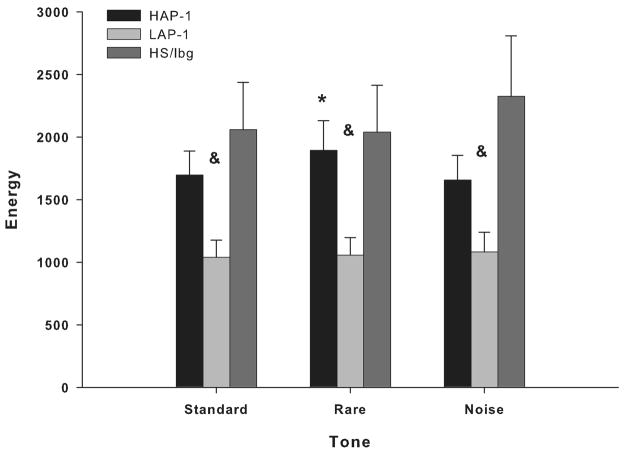
Mouse models have been developed to simulate several relevant human traits associated with alcohol use and dependence. However, the neurophysiological substrates regulating these traits remain to be completely elucidated. We have previously demonstrated that differences in the event-related potential (ERP) responses can be found that distinguish high-alcohol preferring from low alcohol preferring mice that resemble differences seen in human studies of individuals with high and low risk for alcohol dependence. Recently, evidence of genes that affect event-related oscillations (EROs) and the risk for alcohol dependence has emerged, however, to date EROs have not been evaluated in genetic mouse models of high and low alcohol preference. Therefore, the objective of the present study was to characterize EROs in mouse models of high (C57BL/6 [B6] and high alcohol preference 1 [HAP-1] mice) and low (DBA/2J [D2] and low alcohol preference-1 [LAP-1] mice) alcohol preference. A time-frequency representation method was used to determine delta, theta and alpha/beta ERO energy and the degree of phase variation in these mouse models. The present results suggest that the decrease in P3 amplitudes previously shown in B6 mice, compared to D2 mice, is related to reductions in evoked delta ERO energy and delta and theta phase locking. In contrast, the increase in P1 amplitudes reported in HAP-1 mice, compared to LAP-1 mice, is associated with increases in evoked theta ERO energy. These studies suggest that differences in delta and theta ERO measures in mice mirror changes observed between groups at high- and low-risk for alcoholism where changes in EROs were found to be more significant than group differences in P3 amplitudes, further suggesting that ERO measures are more stable endophenotypes in the study of alcohol dependence. Further studies are needed to determine the relationship between expression of these neurophysiological endophenotypes and the genetic profile of these mouse models.
Figures
Similar articles
-
Acute low-level alcohol consumption reduces phase locking of event-related oscillations in rodents.Behav Brain Res. 2017 Jul 14;330:25-29. doi: 10.1016/j.bbr.2017.05.007. Epub 2017 May 8. Behav Brain Res. 2017. PMID: 28495609 Free PMC article.
-
EEG and ERP profiles in the high alcohol preferring (HAP) and low alcohol preferring (LAP) mice: relationship to ethanol preference.Brain Res. 2003 Jan 31;961(2):243-54. doi: 10.1016/s0006-8993(02)03959-8. Brain Res. 2003. PMID: 12531491
-
Event-related oscillations in the parietal cortex of adult alcohol-preferring (P) and alcohol-nonpreferring rats (NP).Alcohol. 2010 Jun;44(4):335-42. doi: 10.1016/j.alcohol.2010.02.004. Epub 2010 Jul 3. Alcohol. 2010. PMID: 20598842 Free PMC article.
-
Neurophysiological maturation in adolescence - vulnerability and counteracting addiction to alcohol.Ann Agric Environ Med. 2017 Mar 22;24(1):19-25. doi: 10.5604/12321966.1234002. Ann Agric Environ Med. 2017. PMID: 28378986 Review.
-
Genetic basis of event-related potentials and their relationship to alcoholism and alcohol use.J Clin Neurophysiol. 1998 Jan;15(1):44-57. doi: 10.1097/00004691-199801000-00006. J Clin Neurophysiol. 1998. PMID: 9502512 Review. No abstract available.
Cited by
-
Delta Event-Related Oscillations Are Related to a History of Extreme Binge Drinking in Adolescence and Lifetime Suicide Risk.Behav Sci (Basel). 2020 Oct 7;10(10):154. doi: 10.3390/bs10100154. Behav Sci (Basel). 2020. PMID: 33036364 Free PMC article.
-
Cholinergic modulation of event-related oscillations (ERO).Brain Res. 2014 Apr 22;1559:11-25. doi: 10.1016/j.brainres.2014.02.043. Epub 2014 Mar 2. Brain Res. 2014. PMID: 24594019 Free PMC article.
-
Acute low-level alcohol consumption reduces phase locking of event-related oscillations in rodents.Behav Brain Res. 2017 Jul 14;330:25-29. doi: 10.1016/j.bbr.2017.05.007. Epub 2017 May 8. Behav Brain Res. 2017. PMID: 28495609 Free PMC article.
-
Effects of adolescent ethanol exposure on event-related oscillations (EROs) in the hippocampus of adult rats.Behav Brain Res. 2010 Jul 11;210(2):164-70. doi: 10.1016/j.bbr.2010.02.021. Epub 2010 Feb 16. Behav Brain Res. 2010. PMID: 20170688 Free PMC article.
-
Decreases in energy and increases in phase locking of event-related oscillations to auditory stimuli occur during adolescence in human and rodent brain.Dev Neurosci. 2014;36(3-4):175-95. doi: 10.1159/000358484. Epub 2014 May 9. Dev Neurosci. 2014. PMID: 24819672 Free PMC article.
References
-
- Amann LC, Phillips JM, Halene TB, Siegel SJ. Male and female mice differ for baseline and nicotine-induced event related potentials. Behav Neurosci. 2008;122:982–990. - PubMed
-
- Basar-Eroglu C, Basar E, Demiralp T, Schurmann M. P300-response: possible psychophysiological correlates in delta and theta frequency channels. A review. Int J Psychophysiol. 1992;13:161–179. - PubMed
-
- Basar E, Basar-Eroglu C, Karakas S, Schurmann M. Are cognitive processes manifested in event-related gamma, alpha, theta and delta oscillations in the EEG? Neurosci Lett. 1999;259:165–168. - PubMed
-
- Basar E, Basar-Eroglu C, Karakas S, Schurmann M. Gamma, alpha, delta, and theta oscillations govern cognitive processes. Int J Psychophysiol. 2001a;39:241–248. - PubMed
-
- Basar E, Schurmann M, Sakowitz O. The selectively distributed theta system: functions. Int J Psychophysiol. 2001b;39:197–212. - PubMed
Publication types
MeSH terms
Grants and funding
LinkOut - more resources
Full Text Sources
Medical
Molecular Biology Databases
Research Materials
Miscellaneous
