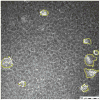
Corneal epithelial opacity in dysfunctional tear syndrome
- PMID: 19541283
- PMCID: PMC2740942
- DOI: 10.1016/j.ajo.2009.04.023
Corneal epithelial opacity in dysfunctional tear syndrome
Abstract
Purpose: To compare the appearance of the superficial corneal epithelium in patients with dysfunctional tear syndrome (DTS) and that of an asymptomatic control group using laser scanning confocal microscopy and to determine the correlations between confocal microscopic findings and clinical severity parameters.
Design: Prospective case-control study.
Methods: Thirty-one patients with newly diagnosed DTS and 21 asymptomatic control subjects were evaluated for this study. Subjects with DTS were classified into 4 levels of clinical severity (DTS 1 through 4) based on the Delphi dry eye panel report criteria. The Heidelberg Retina Tomograph 2 Rostock Cornea Module (Heidelberg Engineering GmbH, Heidelberg, Germany) laser scanning confocal microscope was used to image the superficial corneal epithelium. Areas of single or multiple opaque superficial epithelial cells were measured as a percentage of the 400 x 400-microm(2) field area in 4 randomly selected confocal images from each eye. Spearman correlations between the confocal findings and severity of symptoms, visual acuity, and ocular surface signs were calculated.
Results: The mean area of opaque superficial corneal epithelial cells was significantly greater in DTS patients than in normal subjects (P < .0001). Significant differences were observed between the DTS severity groups and the control group (P < .001), except for the DTS 1 group. The area of opaque cells significantly increased with level of clinical severity. The confocal findings showed significant correlation with clinical severity parameters, including blurred vision symptoms (r = 0.86; P = .0001), best-corrected visual acuity (Spearman r = 0.4; P = .03), conjunctival lissamine green staining scores (Spearman r = 0.4; P = .026), corneal fluorescein staining scores (Spearman r = 0.5; P = .002), and videokeratoscopic surface regularity index (Spearman r = 0.5; P = .02).
Conclusions: Morphologic changes in the superficial corneal epithelium of DTS patients detected by laser scanning confocal microscopy correlates with blurred vision symptoms and objective severity parameters. Objective confocal image analysis of the superficial corneal epithelium may prove useful for classifying DTS severity and for monitoring the efficacy of therapies.
Figures


Similar articles
-
Production and activity of matrix metalloproteinase-9 on the ocular surface increase in dysfunctional tear syndrome.Invest Ophthalmol Vis Sci. 2009 Jul;50(7):3203-9. doi: 10.1167/iovs.08-2476. Epub 2009 Feb 28. Invest Ophthalmol Vis Sci. 2009. PMID: 19255163 Free PMC article.
-
Assessing the severity of keratitis sicca with videokeratoscopic indices.Ophthalmology. 2003 Jun;110(6):1102-9. doi: 10.1016/s0161-6420(03)00245-8. Ophthalmology. 2003. PMID: 12799233
-
[In vivo confocal microscopy and ocular surface diseases: anatomical-clinical correlations].J Fr Ophtalmol. 2005 Sep;28(7):691-8. doi: 10.1016/s0181-5512(05)80980-5. J Fr Ophtalmol. 2005. PMID: 16208218 French.
-
Conjunctival in vivo confocal scanning laser microscopy in patients with Sjögren syndrome.Invest Ophthalmol Vis Sci. 2010 Jan;51(1):144-50. doi: 10.1167/iovs.08-2722. Epub 2009 Aug 20. Invest Ophthalmol Vis Sci. 2010. PMID: 19696170
-
Effects of Prolonged Reading on Dry Eye.Ophthalmology. 2018 Oct;125(10):1500-1505. doi: 10.1016/j.ophtha.2018.03.039. Epub 2018 Apr 25. Ophthalmology. 2018. PMID: 29705055
Cited by
-
Measurement of the time course of optical quality and visual deterioration during tear break-up.Invest Ophthalmol Vis Sci. 2010 Jun;51(6):3318-26. doi: 10.1167/iovs.09-4831. Epub 2010 Jan 27. Invest Ophthalmol Vis Sci. 2010. PMID: 20107168 Free PMC article.
-
Intraocular Scattering, Blinking Rate, and Tear Film Osmolarity After Exposure to Environmental Stress.Transl Vis Sci Technol. 2021 Aug 2;10(9):12. doi: 10.1167/tvst.10.9.12. Transl Vis Sci Technol. 2021. PMID: 34379094 Free PMC article.
-
Tear dysfunction and the cornea: LXVIII Edward Jackson Memorial Lecture.Am J Ophthalmol. 2011 Dec;152(6):900-909.e1. doi: 10.1016/j.ajo.2011.08.023. Epub 2011 Oct 22. Am J Ophthalmol. 2011. PMID: 22019306 Free PMC article.
-
Tear lipocalin captures exogenous lipid from abnormal corneal surfaces.Invest Ophthalmol Vis Sci. 2010 Apr;51(4):1981-7. doi: 10.1167/iovs.09-4622. Epub 2009 Dec 3. Invest Ophthalmol Vis Sci. 2010. PMID: 19959641 Free PMC article.
-
Management of post-LASIK dry eye: a multicenter randomized comparison of a new multi-ingredient artificial tear to carboxymethylcellulose.Clin Ophthalmol. 2018 May 7;12:839-848. doi: 10.2147/OPTH.S163744. eCollection 2018. Clin Ophthalmol. 2018. PMID: 29765198 Free PMC article.
References
-
- Schein OD, Munoz B, Tielsch JM, Bandeen-Roche K, West S. Prevalence of dry eye among the elderly. Am J Ophthalmol. 1997;124:723–728. - PubMed
-
- Moss SE, Klein R, Klein BE. Prevalence of and risk factors for dry eye syndrome. Arch Ophthalmol. 2000;118:1264–1268. - PubMed
-
- McCarty CA, Bansal AK, Livingston PM, Stanislavsky YL, Taylor HR. The epidemiology of dry eye in Melbourne, Australia. Ophthalmology. 1998;105:1114–1119. - PubMed
-
- Behrens A, Doyle JJ, MPH, Stern L, et al. Dysfunctional tear syndrome. A Delphi approach to treatment recommendations. Cornea. 2006;25:900–907. - PubMed
-
- Pflugfelder SC. Anti-inflammatory therapy of dry eye. Am J Ophthalmol. 2004;137:337–342. - PubMed
Publication types
MeSH terms
Substances
Grants and funding
LinkOut - more resources
Full Text Sources
Other Literature Sources

