

Bayesian model predicts the response of axons to molecular gradients
- PMID: 19541606
- PMCID: PMC2700145
- DOI: 10.1073/pnas.0900715106
Bayesian model predicts the response of axons to molecular gradients
Abstract
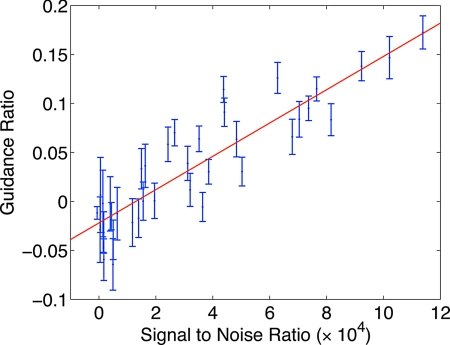
Axon guidance by molecular gradients plays a crucial role in wiring up the nervous system. However, the mechanisms axons use to detect gradients are largely unknown. We first develop a Bayesian "ideal observer" analysis of gradient detection by axons, based on the hypothesis that a principal constraint on gradient detection is intrinsic receptor binding noise. Second, from this model, we derive an equation predicting how the degree of response of an axon to a gradient should vary with gradient steepness and absolute concentration. Third, we confirm this prediction quantitatively by performing the first systematic experimental analysis of how axonal response varies with both these quantities. These experiments demonstrate a degree of sensitivity much higher than previously reported for any chemotacting system. Together, these results reveal both the quantitative constraints that must be satisfied for effective axonal guidance and the computational principles that may be used by the underlying signal transduction pathways, and allow predictions for the degree of response of axons to gradients in a wide variety of in vivo and in vitro settings.
Conflict of interest statement
The authors declare no conflict of interest.
Figures


Similar articles
-
Optimality and saturation in axonal chemotaxis.Neural Comput. 2013 Apr;25(4):833-53. doi: 10.1162/NECO_a_00426. Epub 2013 Jan 22. Neural Comput. 2013. PMID: 23339614
-
Cyclic nucleotide-dependent switching of mammalian axon guidance depends on gradient steepness.Mol Cell Neurosci. 2011 May;47(1):45-52. doi: 10.1016/j.mcn.2011.02.012. Epub 2011 Mar 2. Mol Cell Neurosci. 2011. PMID: 21376124
-
Predicting axonal response to molecular gradients with a computational model of filopodial dynamics.Neural Comput. 2004 Nov;16(11):2221-43. doi: 10.1162/0899766041941934. Neural Comput. 2004. PMID: 15476599
-
Mathematical guidance for axons.Trends Neurosci. 1998 Jun;21(6):226-31. doi: 10.1016/s0166-2236(97)01203-4. Trends Neurosci. 1998. PMID: 9641531 Review.
-
Positional information in neural map development: lessons from the olfactory system.Dev Growth Differ. 2012 Apr;54(3):358-65. doi: 10.1111/j.1440-169X.2012.01334.x. Epub 2012 Mar 8. Dev Growth Differ. 2012. PMID: 22404568 Review.
Cited by
-
Integration of shallow gradients of Shh and Netrin-1 guides commissural axons.PLoS Biol. 2015 Mar 31;13(3):e1002119. doi: 10.1371/journal.pbio.1002119. eCollection 2015 Mar. PLoS Biol. 2015. PMID: 25826604 Free PMC article.
-
Computational Methods for Estimating Molecular System from Membrane Potential Recordings in Nerve Growth Cone.Sci Rep. 2018 Mar 14;8(1):4559. doi: 10.1038/s41598-018-22506-3. Sci Rep. 2018. PMID: 29540815 Free PMC article.
-
The dynamics of growth cone morphology.BMC Biol. 2015 Feb 11;13:10. doi: 10.1186/s12915-015-0115-7. BMC Biol. 2015. PMID: 25729914 Free PMC article.
-
Spatial and temporal sensing limits of microtubule polarization in neuronal growth cones by intracellular gradients and forces.Biophys J. 2012 Dec 19;103(12):2432-45. doi: 10.1016/j.bpj.2012.10.021. Epub 2012 Dec 18. Biophys J. 2012. PMID: 23260045 Free PMC article.
-
The limits of chemosensation vary across dimensions.Nat Commun. 2015 Jun 19;6:7468. doi: 10.1038/ncomms8468. Nat Commun. 2015. PMID: 26088726 Free PMC article.
References
-
- Tessier-Lavigne M, Goodman CS. The molecular biology of axon guidance. Science. 1996;274:1123–1133. - PubMed
-
- Song H, Poo M. The cell biology of neuronal navigation. Nat Cell Biol. 2001;3:E81–E88. - PubMed
-
- Dickson BJ. Molecular mechanisms of axon guidance. Science. 2002;298:1959–1964. - PubMed
-
- Huber AB, Kolodkin AL, Ginty DD, Cloutier JF. Signaling at the growth cone: Ligand–receptor complexes and the control of axon growth and guidance. Annu Rev Neurosci. 2003;26:509–563. - PubMed
-
- Guan KL, Rao Y. Signalling mechanisms mediating neuronal responses to guidance cues. Nat Rev Neurosci. 2003;4:941–956. - PubMed
Publication types
MeSH terms
Substances
LinkOut - more resources
Full Text Sources
