. 2009 Jun 23;106(25):10097-102.
doi: 10.1073/pnas.0900174106. Epub 2009 Jun 16.

Microfabricated tissue gauges to measure and manipulate forces from 3D microtissues

Affiliations

Microfabricated tissue gauges to measure and manipulate forces from 3D microtissues

Wesley R Legant et al. Proc Natl Acad Sci U S A. .

Abstract

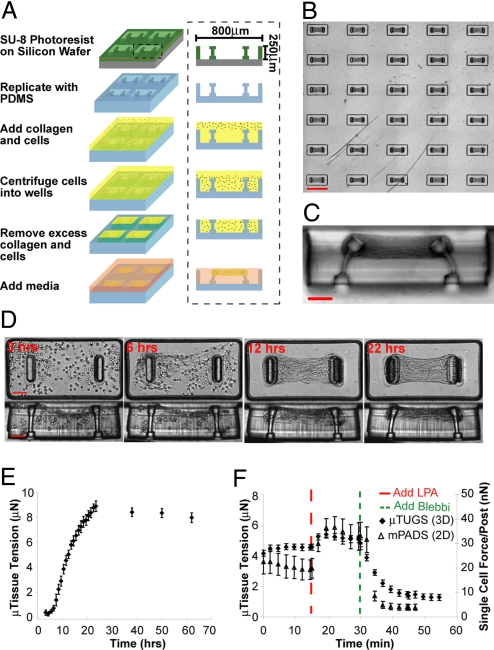
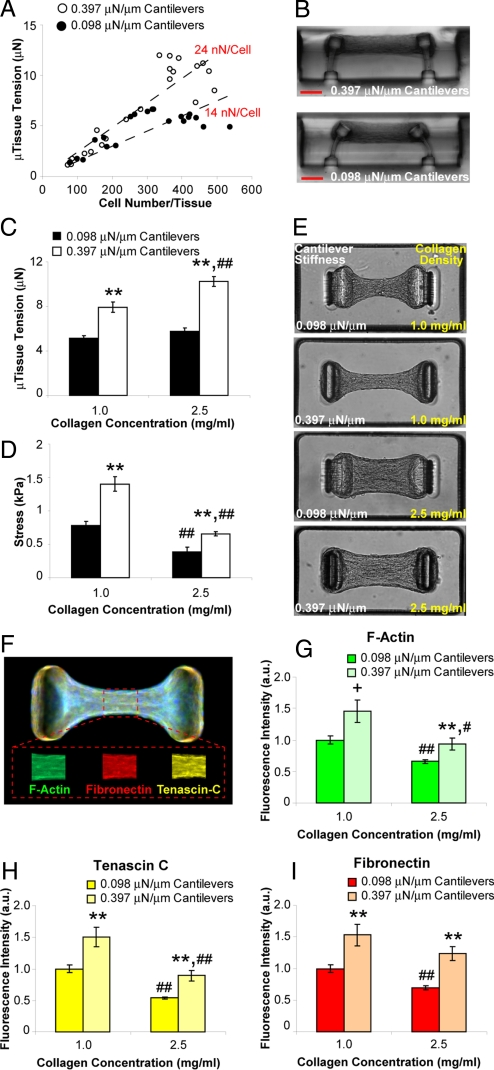
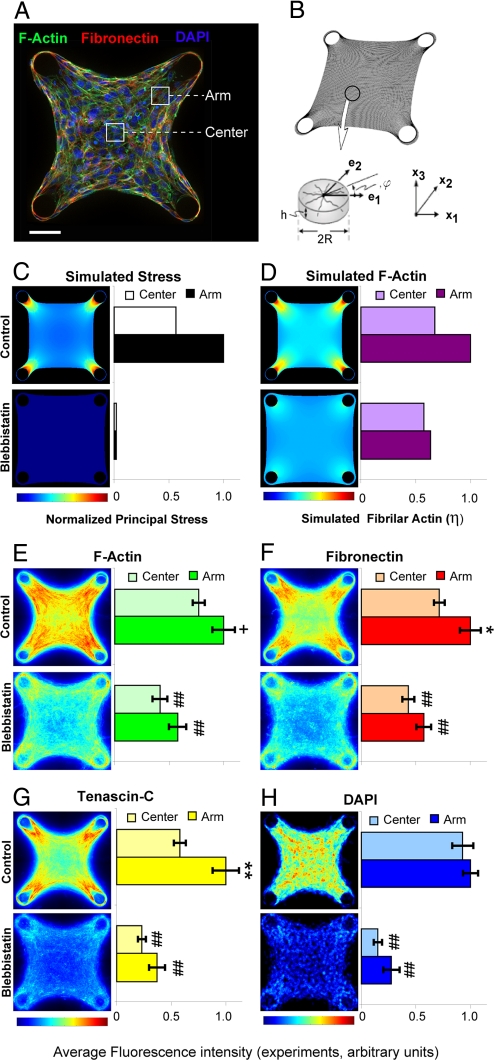
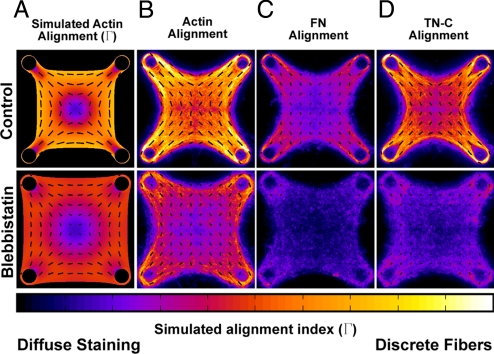
Physical forces generated by cells drive morphologic changes during development and can feedback to regulate cellular phenotypes. Because these phenomena typically occur within a 3-dimensional (3D) matrix in vivo, we used microelectromechanical systems (MEMS) technology to generate arrays of microtissues consisting of cells encapsulated within 3D micropatterned matrices. Microcantilevers were used to simultaneously constrain the remodeling of a collagen gel and to report forces generated during this process. By concurrently measuring forces and observing matrix remodeling at cellular length scales, we report an initial correlation and later decoupling between cellular contractile forces and changes in tissue morphology. Independently varying the mechanical stiffness of the cantilevers and collagen matrix revealed that cellular forces increased with boundary or matrix rigidity whereas levels of cytoskeletal and extracellular matrix (ECM) proteins correlated with levels of mechanical stress. By mapping these relationships between cellular and matrix mechanics, cellular forces, and protein expression onto a bio-chemo-mechanical model of microtissue contractility, we demonstrate how intratissue gradients of mechanical stress can emerge from collective cellular contractility and finally, how such gradients can be used to engineer protein composition and organization within a 3D tissue. Together, these findings highlight a complex and dynamic relationship between cellular forces, ECM remodeling, and cellular phenotype and describe a system to study and apply this relationship within engineered 3D microtissues.


Conflict of interest statement

The authors declare no conflict of interest.

Figures

Fig. 1.
Fig. 1.
Fabrication method and temporal response of microtissues. (A) Process flow diagram for the creation of μTUG arrays. (B) Large arrays of microtissues are simultaneously generated on a substrate. (C) Cross section view of a single μTUG well. (D) Representative images depicting the time course of a contracting microtissue. (E) Time course of forces generated during microtissue contraction. Data points represent the average force for 5 microtissues ± SEM. (F) The temporal response of microtissues (closed diamonds) and single cells on mPADs (open triangles) in response to 10 μg/mL LPA and 50 μM blebbistatin. Data points represent the average force for 10 microtissues or 5 individual cells ± SEM. (Scale bars: B, 800 μm; C and D, 100 μm.)
Fig. 2.
Fig. 2.
Boundary and matrix mechanics regulate cellular contractility and protein deposition. (A) Plot of microtissue tension vs. number of cells per tissue for constructs tethered to rigid (0.397 μN/μm, open circles) or flexible (0.098 μN/μm, closed circles) cantilevers. (B) Representative cross sections of microtissues tethered to rigid or flexible cantilevers. (C) Plot of average microtissue tension for tissues constructed from 1.0 mg/mL or 2.5 mg/mL collagen gels tethered to rigid or flexible cantilevers. (D) Plot of average midpoint stress for tissues constructed from 1.0 mg/mL or 2.5 mg/mL collagen tethered to rigid or flexible cantilevers. (E) Phase contrast images of microtissues in each of the 4 combinations of collagen density and cantilever stiffness. (F) Representative immunofluorescence overlay of cytoskeletal and ECM proteins within microtissues. Mean fluorophore intensity was measured over a 30-μm long segment at the tissue midsection using distinct fluorphores for each protein (Inset). (G–I) Plots of average relative fibrillar actin, fibronectin and tenascin C levels under each of the 4 combinations of collagen density and cantilever stiffness. Data from (C and D) are the average of 15 microtissues from each condition ± SEM. Data from (G–I) are the average of 40 microtissues for each condition ± SEM. **, P < 0.01; *, P < 0.05; +, P < 0.05 (Student's t test) P = 0.15 (MWU) for 0.397 vs. 0.098 μN/μm cantilevers; ##, P < 0.01; #, P < 0.05 for 2.5 vs. 1.0 mg/mL collagen. (Scale bar: 100 μm.)
Fig. 3.
Fig. 3.
Predicted stress gradients within microtissues mirror patterned intratissue protein levels. (A) Immunofluorescence optical section of a microtissue tethered to 4 cylindrical posts showing: filamentous actin-green, fibronectin-red, and DAPI-blue. Arm and center regions used for quantification are indicated. (B) Finite element mesh and representative volume element for stress fiber formation used in a computational model of actin-myosin contraction. (C) Simulated distribution of principal stresses within a microtissue under 100% (control) and 10% (blebbistatin) conditions for simulated stress fiber contraction. (D) Simulated distribution of fibrillar actin within a microtissue under 100% (control) and 10% (blebbistatin) conditions for simulated stress fiber contraction. (E–G) Heat maps showing distribution of filamentous actin, fibronectin and tenascin C constructed from optical sections of microtissues under control and blebbistatin (50 μΜ) conditions. (H) Heat map of DAPI staining within microtissues under control and blebbistatin (50 μΜ) conditions. Heat maps are 2D projections of immunofluorescence staining from 120 optical sections (≈10 sections per microtissue for 12 different microtissues in each condition). **, P < 0.01; *, P < 0.05; +, P = 0.06 (Student's t test and MWU) for arm vs. center; ##, P < 0.01, for blebbistatin vs. control. (Scale bar: 50 μm.)
Fig. 4.
Fig. 4.
Tension induced alignment of cytoskeletal and ECM proteins within patterned microtissues. (A) Simulated bundling (Γ) and alignment of actin fibers within a microtissue under 100% (control) and 10% (blebbistatin) conditions for simulated stress fiber contraction. (B–D) Heat maps depicting degree of bundling and alignment of actin, fibronectin and tenascin C based on fluorescence images of microtissues under control and blebbistatin (50 μΜ) conditions. In all cases, quiver orientation indicates orientation of the simulated or observed fibrils. Quiver length and heat map colors depict how distinctly these proteins are bundled (clustered into discrete fibers). Alignment data for each protein was quantified from immunofluorescence staining of 120 optical sections (≈10 sections per microtissue for 12 different microtissues in each condition).

References

    1. Beloussov LV, Dorfman JG, Cherdantzev VG. Mechanical stresses and morphological patterns in amphibian embryos. J Embryol Exp Morphol. 1975;34:559–574. - PubMed
    1. Taber LA. Biomechanics of growth, remodeling, and morphogenesis. Appl Mech Rev. 1995;48:487–545.
    1. Keller R, Davidson LA, Shook DR. How we are shaped: The biomechanics of gastrulation. Differentiation. 2003;71:171–205. - PubMed
    1. Tomasek JJ, Gabbiani G, Hinz B, Chaponnier C, Brown RA. Myofibroblasts and mechano-regulation of connective tissue remodelling. Nat Rev Mol Cell Biol. 2002;3:349–363. - PubMed
    1. Wolff J. In: Das gesetz der transformation der knochen, Kirschwald. Maquet P, Furlong R, translators. Berlin: Springer; 1892. (1986) (German)

Publication types

Substances