. 2009 Aug 4;106(31):12599-604.
doi: 10.1073/pnas.0902070106. Epub 2009 Jun 16.

Real-time molecular monitoring of chemical environment in obligate anaerobes during oxygen adaptive response

Affiliations

Real-time molecular monitoring of chemical environment in obligate anaerobes during oxygen adaptive response

Hoi-Ying N Holman et al. Proc Natl Acad Sci U S A. .

Abstract

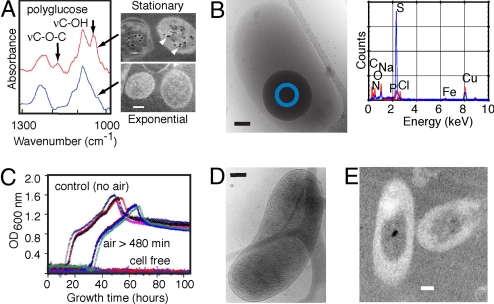
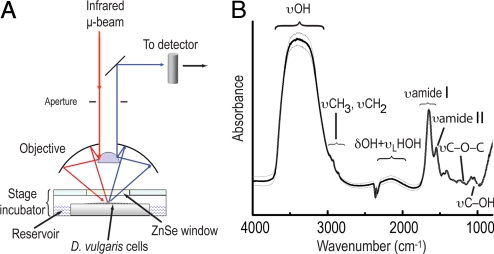
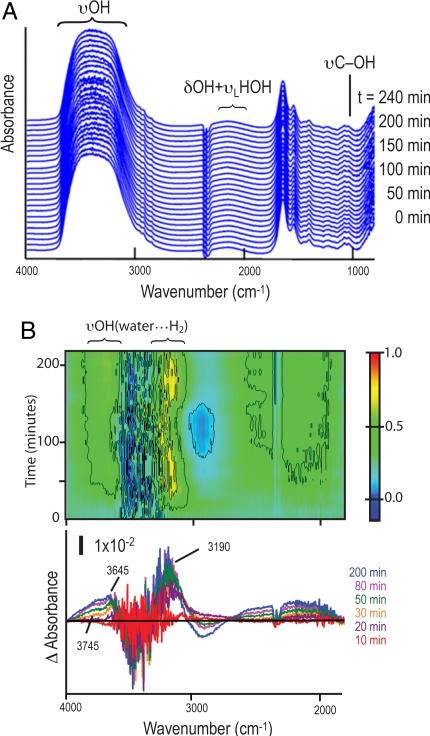
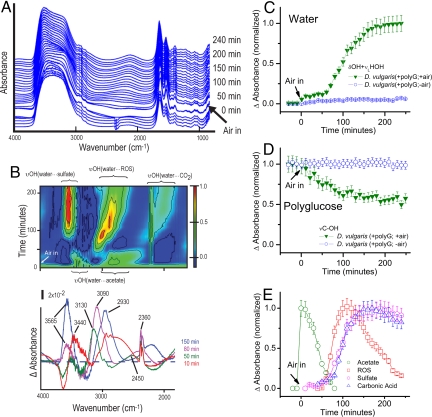
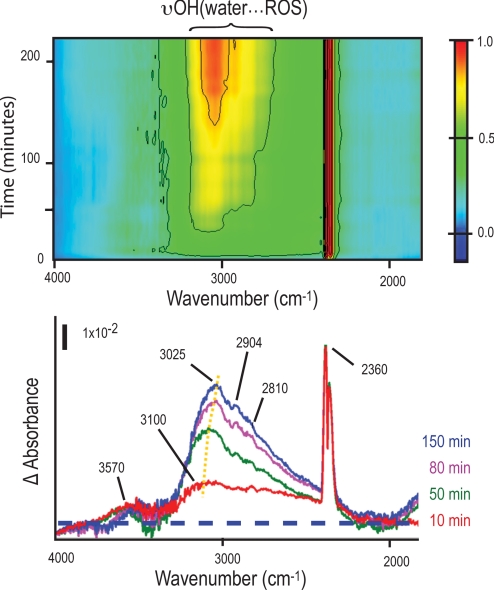
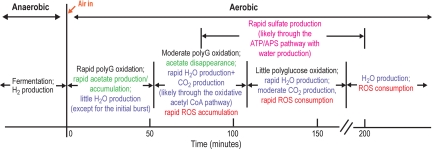
Determining the transient chemical properties of the intracellular environment can elucidate the paths through which a biological system adapts to changes in its environment, for example, the mechanisms that enable some obligate anaerobic bacteria to survive a sudden exposure to oxygen. Here we used high-resolution Fourier transform infrared (FTIR) spectromicroscopy to continuously follow cellular chemistry within living obligate anaerobes by monitoring hydrogen bond structures in their cellular water. We observed a sequence of well orchestrated molecular events that correspond to changes in cellular processes in those cells that survive, but only accumulation of radicals in those that do not. We thereby can interpret the adaptive response in terms of transient intracellular chemistry and link it to oxygen stress and survival. This ability to monitor chemical changes at the molecular level can yield important insights into a wide range of adaptive responses.


Conflict of interest statement

The authors declare no conflict of interest.

Figures

Fig. 1.
Fig. 1.
Microscopic and spectroscopic analyses of Desulfovibrio vulgaris. (A) Left, typical infrared absorption spectra of stationary-phase (red) and exponential-phase (blue) D. vulgaris; Right, transmission electron microscopy (TEM) images of thin sections poststained by the periodic acid thiosemicarbazide-osmium (PATO) method (51) show intracellular polyglucose granules (arrows) in stationary-phase but not exponential-phase D. vulgaris. (B) Left, cryo-electron microscopy (Cryo-EM) image of a stationary-phase cell containing a large, dense ball; Right, energy dispersive X-ray analysis of freeze-dried cells with (blue) and without (red) such structures. Spectra from areas such as marked by the blue circle in the left image show that the particle contains mainly sulfur. (C) Re-growth of D. vulgaris after exposure to air. Note the approximate 20-h lag-time (compared to controls). Different colors represent different viability experiments. (D and E) Cryo-EM (Left) and TEM/PATO (Right) images of D. vulgaris after exposure to air for hours show changes in cell membranes, variation in periplasmic space, mottled appearance of cell contents and decreased number of polyglucose granules compared to the unexposed cell in Figs. 1 A and B. The frequency of cells showing such alterations compared to those with substantially more damage suggests that these cells were still alive. (Scale bars, 0.2 μm.)
Fig. 2.
Fig. 2.
FTIR measurement setup. (A) Schematic description of the experimental measurement setup. An all-reflective optics infrared microscope focuses the interferometer-modulated synchrotron infrared microbeam through a 15-μm aperture onto a monolayer (see Methods) of live D. vulgaris. The reflected signals are collected and sent to the detector. The optical density of this thin film is typically 0.05 at the band dominated by the combined water-bending vibration and libration at ≈2,100 cm−1. This is an equivalent to a water-film of ≈1.5-μm thick. This experimental system enables FTIR measurements with a temporal resolution of every minute for up to 4 h; a different experimental arrangement would be needed to investigate changes on a finer temporal scale or a longer duration. (B) Spectral variations in polyglucose-accumulated stationary-phase D. vulgaris in anaerobic atmosphere. The spectrum shows the polyglucose C−OH vibration (υC−OH) band between 1,055 and 1,045 cm−1. Within the hydride-OH dominated stretch region between 1,900 and 3,800 cm−1 are a broad OH stretching (υOH) band between 2,900 and 3,700 cm−1, the combined water OH bending and libration modes (δOH +υLHOH) at ≈2,100 cm−1. Absorption bands between 1,800 and 900 cm−1 are dominated by vibration motion of biomolecules of D. vulgaris. Averaged spectrum (black line) ± 1.0 standard deviation (gray lines); n = 50.
Fig. 3.
Fig. 3.
FTIR analyses of D. vulgaris in anaerobic atmosphere. (A) Real-time FTIR spectra of polyglucose-accumulated stationary-phase D. vulgaris in an anaerobic environment. Sequential spectra are offset vertically for clarity. Since all spectra are derived using air as a reference, the negative spectral feature at ≈2,348 cm−1 (associated with lack of atmospheric CO2) is a marker for an air-free condition throughout this investigation. (B) FTIR time-difference spectra in the hydride-OH dominated stretch region. Top, a 2-dimensional frequency-time contour plot (the time-difference intensities are normalized to the maximum); Bottom, snapshots for selected different time points. Positive bands [labeled as υOH(water···H2)] arise from υOH of water molecules forming H-bonding with H2 (≈3,190; ≈3,640, and ≈3,745 cm−1). The straight black line marks that difference absorbance = 0.
Fig. 4.
Fig. 4.
FTIR analyses of D. vulgaris during oxygen-stress adaptive response. (A) Typical real-time FTIR spectra of polyglucose-accumulated stationary-phase D. vulgaris transition from an anaerobic to aerobic environment. Sequential spectra are offset upward for clarity. Since all spectra are derived using air as a reference, the abrupt change in the spectral feature at ≈2,348 cm−1 associated with the presence of atmospheric CO2. (B) Corresponding FTIR time-difference spectra in the hydride-OH dominated stretch region. Top, a 2-dimensional frequency-time contour plot (the time-difference intensities are normalized to the maximum); Bottom, snapshots for selected different time points. The dashed line marks that difference absorbance = 0. Positive values arise from υOH of water molecules forming H-bonding with acetate (≈3,440; ≈2,930 cm−1) [labeled as υOH(water···acetate)], reactive oxygen species ROS (≈3,090 cm−1) [labeled as υOH(water···ROS)], sulfate (≈3,565 cm−1) [labeled as υOH(water···sulfate)], and carbonic acid (≈2,450 cm−1) [labeled as υOH(water···CO2)]. The positive absorption feature at ≈2,360 cm−1 is from CO2 in air. (C and D). Typical time course of infrared intensity (normalized by the maximum value) of water and polyglucose content. (Bars, ±10% error.) (E) Transient chemistry as seen by the time-course of difference absorbance normalized by the maximum value for each species. (Bars, ±10% error.)
Fig. 5.
Fig. 5.
Typical FTIR difference spectra show reactive oxygen species (ROS) build-up in polyglucose-deficient exponential-phase D. vulgaris. Top, a 2-dimensional frequency-time contour plot (the time-difference intensities are normalized to the maximum); Bottom, snapshots for selected different time points. The peak centered at ≈3,100 cm−1 and other local maxima centered at ≈2,904 cm−1 and 2,810 cm−1 are at frequencies typical of the υOH of water molecules H-bonding with hydroxyl and hydroperoxyl radicals [labeled as υOH(water···ROS)]. The feature at ≈3,570 cm−1 is at a frequency typical of the υOH of water molecules H-bonded to sulfate anions. Yellow dots mark the red-shift of ≈75 cm−1 of υOH of hydroxyl radical band peak. The dashed line marks that difference absorbance = 0. The positive absorption feature at ≈2,360 cm−1 is from CO2 in air.
Fig. 6.
Fig. 6.
A summary of the evolving cellular chemical environment and possible survival mechanisms inside the same living D. vulgaris during its transient oxygen-stress and adaptive response, as revealed by the real-time high-resolution synchrotron FTIR measurements and analyses. Polyglucose is labeled as PolyG.

Similar articles

Cited by

References

    1. Fay P. Oxygen relations of nitrogen-fixation in Cyanobacteria. Microbiol Rev. 1992;56:340–373. - PMC - PubMed
    1. Bradshaw DJ, Marsh PD, Watson GK, Allison C. Role of Fusobacterium nucleatum and coaggregation in anaerobe survival in planktonic and biofilm oral microbial communities during aeration. Infect Immun. 1998;66:4729–4732. - PMC - PubMed
    1. Cypionka H. Oxygen respiration by Desulfovibrio species. Annu Rev Microbiol. 2000;54:827–848. - PubMed
    1. Baughn AD, Malamy MH. Molecular Basis for Aerotolerance of the Obligately Anaerobic Bacteroides Spp. In: Nakano MM, Zuber P, editors. Strict and Facultative Anaerobes: Medical and Environmental Aspects. New York: CRC Press; 2004. pp. 161–169.
    1. Dolla A, Fournier M, Dermoun Z. Oxygen defense in sulfate-reducing bacteria. J Biotechnol. 2006;126:87–100. - PubMed

Publication types

MeSH terms