Three-dimensional measurement of alveolar airspace volumes in normal and emphysematous lungs using micro-CT
- PMID: 19541732
- PMCID: PMC2724324
- DOI: 10.1152/japplphysiol.91227.2008
Three-dimensional measurement of alveolar airspace volumes in normal and emphysematous lungs using micro-CT
Abstract
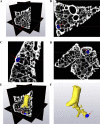
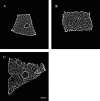
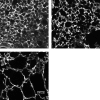
In pulmonary emphysema, the alveolar structure progressively breaks down via a three-dimensional (3D) process that leads to airspace enlargement. The characterization of such structural changes has, however, been based on measurements from two-dimensional (2D) tissue sections or estimates of 3D structure from 2D measurements. In this study, we developed a novel silver staining method for visualizing tissue structure in 3D using micro-computed tomographic (CT) imaging, which showed that at 30 cmH20 fixing pressure, the mean alveolar airspace volume increased from 0.12 nl in normal mice to 0.44 nl and 2.14 nl in emphysematous mice, respectively, at 7 and 14 days following elastase-induced injury. We also assessed tissue structure in 2D using laser scanning confocal microscopy. The mean of the equivalent diameters of the alveolar airspaces was lower in 2D compared with 3D, while its variance was higher in 2D than in 3D in all groups. However, statistical comparisons of alveolar airspace size from normal and emphysematous mice yielded similar results in 2D and 3D: compared with control, both the mean and variance of the equivalent diameters increased by 7 days after treatment. These indexes further increased from day 7 to day 14 following treatment. During the first 7 days following treatment, the relative change in SD increased at a much faster rate compared with the relative change in mean equivalent diameter. We conclude that quantifying heterogeneity in structure can provide new insight into the pathogenesis or progression of emphysema that is enhanced by improved sensitivity using 3D measurements.
Figures


Similar articles
-
Alveolar fractal box dimension inversely correlates with mean linear intercept in mice with elastase-induced emphysema.Int J Chron Obstruct Pulmon Dis. 2012;7:235-43. doi: 10.2147/COPD.S26493. Epub 2012 Mar 27. Int J Chron Obstruct Pulmon Dis. 2012. PMID: 22500123 Free PMC article.
-
Evaluation of cigarette smoke-induced emphysema in mice using quantitative micro-computed tomography.Am J Physiol Lung Cell Mol Physiol. 2015 May 15;308(10):L1039-45. doi: 10.1152/ajplung.00366.2014. Epub 2015 Mar 27. Am J Physiol Lung Cell Mol Physiol. 2015. PMID: 25820526
-
Collagen content of alveolar wall tissue in emphysematous and non-emphysematous lungs.Thorax. 1994 Apr;49(4):319-26. doi: 10.1136/thx.49.4.319. Thorax. 1994. PMID: 8202900 Free PMC article.
-
A review of techniques for visualising soft tissue microstructure deformation and quantifying strain Ex Vivo.J Microsc. 2018 Dec;272(3):165-179. doi: 10.1111/jmi.12701. Epub 2018 Apr 14. J Microsc. 2018. PMID: 29655273 Review.
-
[Micro-computed tomography of the vasculature in parenchymal organs and lung alveoli].Rofo. 2004 Sep;176(9):1219-25. doi: 10.1055/s-2004-813403. Rofo. 2004. PMID: 15346254 Review. German.
Cited by
-
Three-Dimensional Whole-Organ Characterization of the Regional Alveolar Morphology in Normal Murine Lungs.Front Physiol. 2021 Dec 8;12:755468. doi: 10.3389/fphys.2021.755468. eCollection 2021. Front Physiol. 2021. PMID: 34955878 Free PMC article.
-
The role of three-dimensionality and alveolar pressure in the distribution and amplification of alveolar stresses.Sci Rep. 2019 Jun 19;9(1):8783. doi: 10.1038/s41598-019-45343-4. Sci Rep. 2019. PMID: 31217511 Free PMC article.
-
Mechanical Forces Accelerate Collagen Digestion by Bacterial Collagenase in Lung Tissue Strips.Front Physiol. 2016 Jul 12;7:287. doi: 10.3389/fphys.2016.00287. eCollection 2016. Front Physiol. 2016. PMID: 27462275 Free PMC article.
-
Enhanced reseeding of decellularized rodent lungs with mouse embryonic stem cells.Biomaterials. 2014 Mar;35(10):3252-62. doi: 10.1016/j.biomaterials.2013.12.093. Epub 2014 Jan 15. Biomaterials. 2014. PMID: 24439414 Free PMC article.
-
MRI-based measurements of aerosol deposition in the lung of healthy and elastase-treated rats.J Appl Physiol (1985). 2014 Jun 15;116(12):1561-8. doi: 10.1152/japplphysiol.01165.2013. Epub 2014 May 1. J Appl Physiol (1985). 2014. PMID: 24790020 Free PMC article.
References
-
- American Thoracic Society. Standards for the diagnosis and care of patients with chronic obstructive pulmonary disease. Am J Respir Crit Care Med 152: S77–121, 1995. - PubMed
-
- Bachofen H, Ammann A, Wangensteen D, Weibel ER. Perfusion fixation of lungs for structure-function analysis: credits and limitations. J Appl Physiol 53: 528–533, 1982. - PubMed
-
- Baddeley AJ, Gundersen HJ, Cruz-Orive LM. Estimation of surface area from vertical sections. J Microsc 142: 259–276, 1986. - PubMed
-
- Bassam BJ, Caetano-Anollés G, Gresshoff PM. Fast and sensitive silver staining of DNA in polyacrylamide gels. Anal Biochem 196: 80–83, 1991. - PubMed
Publication types
MeSH terms
Substances
Grants and funding
LinkOut - more resources
Full Text Sources

