Autophagy-mediated insulin receptor down-regulation contributes to endoplasmic reticulum stress-induced insulin resistance
- PMID: 19541767
- PMCID: PMC2730390
- DOI: 10.1124/mol.109.057067
Autophagy-mediated insulin receptor down-regulation contributes to endoplasmic reticulum stress-induced insulin resistance
Abstract
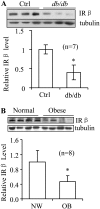
Endoplasmic reticulum (ER) stress is associated with obesity-induced insulin resistance, yet the underlying mechanisms remain to be fully elucidated. Here we show that ER stress-induced insulin receptor (IR) down-regulation may play a critical role in obesity-induced insulin resistance. The expression levels of IR are negatively associated with the ER stress marker C/EBP homologous protein (CHOP) in insulin target tissues of db/db mice and mice fed a high-fat diet. Significant IR down-regulation was also observed in fat tissue of obese human subjects and in 3T3-L1 adipocytes treated with ER stress inducers. ER stress had little effect on IR tyrosine phosphorylation per se but greatly reduced IR downstream signaling. The ER stress-induced reduction in IR cellular levels was greatly alleviated by the autophagy inhibitor 3-methyladenine but not by the proteasome inhibitor N-benzoyloxycarbonyl (Z)-Leu-Leu-leucinal (MG132). Inhibition of autophagy prevented IR degradation but did not rescue IR downstream signaling, consistent with an adaptive role of autophagy in response to ER stress-induced insulin resistance. Finally, chemical chaperone treatment protects cells from ER stress-induced IR degradation in vitro and obesity-induced down-regulation of IR and insulin action in vivo. Our results uncover a new mechanism underlying obesity-induced insulin resistance and shed light on potential targets for the prevention and treatment of obesity-induced insulin resistance and type 2 diabetes.
Figures


Similar articles
-
DsbA-L alleviates endoplasmic reticulum stress-induced adiponectin downregulation.Diabetes. 2010 Nov;59(11):2809-16. doi: 10.2337/db10-0412. Epub 2010 Aug 10. Diabetes. 2010. PMID: 20699416 Free PMC article.
-
Autophagy: roles in obesity-induced ER stress and adiponectin downregulation in adipocytes.Autophagy. 2010 Nov;6(8):1196-7. doi: 10.4161/auto.6.8.13478. Epub 2010 Nov 16. Autophagy. 2010. PMID: 20864818 Free PMC article.
-
FFA-induced adipocyte inflammation and insulin resistance: involvement of ER stress and IKKβ pathways.Obesity (Silver Spring). 2011 Mar;19(3):483-91. doi: 10.1038/oby.2010.200. Epub 2010 Sep 9. Obesity (Silver Spring). 2011. PMID: 20829802
-
A guide to understanding endoplasmic reticulum stress in metabolic disorders.Mol Metab. 2021 May;47:101169. doi: 10.1016/j.molmet.2021.101169. Epub 2021 Jan 20. Mol Metab. 2021. PMID: 33484951 Free PMC article. Review.
-
Endoplasmic Reticulum Stress and Obesity.Adv Exp Med Biol. 2024;1460:373-390. doi: 10.1007/978-3-031-63657-8_13. Adv Exp Med Biol. 2024. PMID: 39287859 Review.
Cited by
-
Autophagy in Adipose Tissue Physiology and Pathophysiology.Antioxid Redox Signal. 2019 Aug 20;31(6):487-501. doi: 10.1089/ars.2018.7626. Epub 2018 Nov 1. Antioxid Redox Signal. 2019. PMID: 30234364 Free PMC article. Review.
-
Wen-pi-tang-Hab-Wu-ling-san, a Polyherbal Medicine, Attenuates ER Stress in 3T3-L1 Preadipocytes by Promoting the Insulin Signaling Pathway.Evid Based Complement Alternat Med. 2013;2013:825814. doi: 10.1155/2013/825814. Epub 2013 Dec 22. Evid Based Complement Alternat Med. 2013. PMID: 24454515 Free PMC article.
-
TarGo: network based target gene selection system for human disease related mouse models.Lab Anim Res. 2019 Nov 13;35:23. doi: 10.1186/s42826-019-0023-z. eCollection 2019. Lab Anim Res. 2019. PMID: 32257911 Free PMC article.
-
Curcumin Improves Palmitate-Induced Insulin Resistance in Human Umbilical Vein Endothelial Cells by Maintaining Proteostasis in Endoplasmic Reticulum.Front Pharmacol. 2017 Mar 21;8:148. doi: 10.3389/fphar.2017.00148. eCollection 2017. Front Pharmacol. 2017. Retraction in: Front Pharmacol. 2023 Jul 06;14:1247749. doi: 10.3389/fphar.2023.1247749. PMID: 28377722 Free PMC article. Retracted.
-
Autophagy regulates insulin resistance following endoplasmic reticulum stress in diabetes.J Physiol Biochem. 2015 Jun;71(2):319-27. doi: 10.1007/s13105-015-0384-1. Epub 2015 Jan 30. J Physiol Biochem. 2015. PMID: 25632827 Review.
References
-
- Aguirre V, Uchida T, Yenush L, Davis R, and White MF (2000) The c-Jun NH(2)-terminal kinase promotes insulin resistance during association with insulin receptor substrate-1 and phosphorylation of Ser(307). J Biol Chem 275 9047-9054. - PubMed
-
- Bandyopadhyay GK, Yu JG, Ofrecio J, and Olefsky JM (2005) Increased p85/55/50 expression and decreased phosphotidylinositol 3-kinase activity in insulin-resistant human skeletal muscle. Diabetes 54 2351-2359. - PubMed
-
- Boden G, Chen X, Ruiz J, Heifets M, Morris M, and Badosa F (1994) Insulin receptor down-regulation and impaired antilipolytic action of insulin in diabetic patients after pancreas/kidney transplantation. J Clin Endocrinol Metab 78 657-663. - PubMed
-
- Ebato C, Uchida T, Arakawa M, Komatsu M, Ueno T, Komiya K, Azuma K, Hirose T, Tanaka K, Kominami E, et al. (2008) Autophagy is important in islet homeostasis and compensatory increase of beta cell mass in response to high-fat diet. Cell Metab 8 325-332. - PubMed
-
- Eizirik DL, Cardozo AK, and Cnop M (2008) The role for endoplasmic reticulum stress in diabetes mellitus. Endocr Rev 29 42-61. - PubMed
Publication types
MeSH terms
Substances
Grants and funding
LinkOut - more resources
Full Text Sources
Medical
Research Materials
Miscellaneous

